Geography of British Columbia
British Columbia is the westernmost province of Canada, bordered by the Pacific Ocean. With an area of 944,735 km2 (364,764 sq mi) it is Canada's third-largest province. The province is almost four times the size of the United Kingdom and larger than every United States state except Alaska. It is bounded on the northwest by the U.S. state of Alaska, directly north by Yukon and the Northwest Territories, on the east by Alberta, and on the south by the U.S. states of Washington, Idaho, and Montana. Formerly part of the British Empire, the southern border of British Columbia was established by the 1846 Oregon Treaty. The province is dominated by mountain ranges, among them the Canadian Rockies but dominantly the Coast Mountains, Cassiar Mountains, and the Columbia Mountains. Most of the population is concentrated on the Pacific coast, notably in the area of Vancouver, located on the southwestern tip of the mainland, which is known as the Lower Mainland. It is the most mountainous province of Canada.
| Continent | North America |
|---|---|
| Region | Western Canada |
| Coordinates | 49°00′N 114°04′W / 49.000°N 114.067°W -- 60°00′N 139°03′W / 60.000°N 139.050°W |
| Area | Ranked 3rd among provinces |
| • Total | 944,735 km2 (364,764 sq mi) |
| • Land | 97.9% |
| • Water | 2.1% |
| Coastline | 27,000 km (17,000 mi) |
| Borders | Total land borders: United States: Alaska, Washington, Idaho, Montana; Canadian provinces Alberta, Yukon, Northwest Territories |
| Highest point | Mount Fairweather 4,663 m (15,299 ft) |
| Lowest point | Pacific Ocean sea level |
| Longest river | Fraser River 1,368 km (850 mi) |
| Largest lake | Williston Lake 1,761 km2 (680 sq mi) |
Statistics
- Total area: 944,735 km (587,031 mi)
- Land area: 925,186 km (574,884 mi)
- Water area: 19,549 km (12,147 mi) (2.1%)
Physical geography
British Columbia is customarily divided into three main regions, the Interior, the Coast and the Lower Mainland (though the last-named is technically part of the Coast). These are broken up by a loose and often overlapping system of cultural-geographic regions, often based on river basins but sometimes spanning them. Examples of the former would be the Kootenays, the Okanagan, and the Chilcotin, while of the latter would be the Lillooet Country and Cariboo. Important subareas of these include the Fraser Valley, part of the Lower Mainland, the Fraser Canyon (which overlaps with various regions) and the Robson Valley, which is the uppermost basin of the Fraser River southeast of Prince George. Vancouver Island is seen as its own region within the Coast, as are the Haida Gwaii (Queen Charlotte Islands) and the Gulf Islands.
Terrain
The Canadian Rockies, Coast Mountains and Inside Passage provide some of British Columbia's renowned and spectacular scenery. These landforms provide the backdrop and context for a growing outdoor adventure and ecotourism industry. In the southwestern corner of B.C., the Lower Fraser Valley forms a flat, fertile triangle of intensively used land. The city of Penticton and the small towns Oliver, and Osoyoos have some of the warmest summer climates in Canada, although the hottest spots are the towns of Lillooet and Lytton in the Fraser Canyon. Nearly all of the Coast including much of Vancouver Island is covered by a temperate rain forest. One-third of the province consists of barren alpine tundra, icefields, and glaciers.
Mountains and mountain ranges
The landforms of British Columbia include two major continental landforms, the Interior Plains in the province's northeast, the British Columbia portion of which is part of the Alberta Plateau. The rest of the province is part of the Western Cordillera of North America, often referred to in Canada as the Pacific Cordillera or Canadian Cordillera. The Cordillera is subdivided into four main "systems" (which are distinct from the corresponding region's geologic provinces):[1]
Eastern System
B.C.'s Eastern Mountain System comprises the dominant Canadian Rockies, with the Cariboo, Selkirk, Monashee, and Purcell ranges of the Columbia Mountains system in the south, and the Hart Ranges & Muskwa Ranges of the Northern Rocky Mountains to the north The Canadian Rockies incorporate the Canadian segment of the North American Rocky Mountains range. The southern end in Alberta and British Columbia borders Idaho and Montana of the United States. The northern end is at the Liard Plain in British Columbia.
Interior System
The Interior System comprises the Interior Plateau and Interior Mountains (aka the Northern Interior Mountains) and the southern part of the Yukon Plateau. The major subdivisions of the Interior Mountains are the Cassiar Mountains, Omineca Mountains, Stikine Plateau, Skeena Mountains and Hazelton Mountains. Each has a variety of subranges and some definitions include the Tahltan Highland and Tagish Highland which may also be assigned to the Boundary Ranges of the Coast Mountains (see next). The major subdivisions of the Interior Plateau are the Nechako Plateau, the McGregor Plateau, the Fraser Plateau (which includes the Chilcotin Plateau and Cariboo Plateau and a number of small mountain ranges) and the Thompson Plateau. The Quesnel, Shuswap and Okanagan Highlands which flank the plateau to the east are sometimes seen as part of it, but are officially part of the Columbia Mountains range-system and are seen as subranges of the adjoining ranges, namely the Cariboo Mountains and Monashee Mountains.
Western System
The Western System comprises the Coast Mountains, the Canadian portion of the Cascade Mountains (known in the US as the Cascade Range), the southeasternmost Saint Elias Mountains and the Coastal Trough, which includes the Georgia Depression and its subunit the Fraser Lowland and other low-lying coastal areas.
The Western Mountain System's Coast Mountains are the westernmost range of the Pacific Cordillera, running along the western shore of the North American continent, extending south from the Alaska Panhandle and covering most of coastal British Columbia. The range is covered in dense temperate rainforest on its western exposures, the range rises to heavily glaciated peaks, including the largest temperate-latitude icefields in the world, and then tapers to the dry Interior Plateau on its eastern flanks, or to the subarctic boreal forest of the Skeena Mountains and Stikine Plateau.
Mount Waddington (4016 m) is the highest mountain within B.C. and Fairweather Mountain in the Fairweather Range of the Saint Elias Mountains on the B.C. and Alaska border has the highest point. Much of the B.C. coast has a fjord scenery, due to the many islands along the Pacific coast being the highest points of a partly submerged mountain range.
Insular System
The Insular System comprises the Insular Mountains, which include the Vancouver Island Ranges and Queen Charlotte Mountains as well as the Nanaimo Lowland, Nahwitti Lowland and Hecate Depression.
Geology and orogeny
The younger ranges of the Canadian Rockies were uplifted during the late Cretaceous period (145 million-66 million years ago) and are a relatively new, tall and uneroded mountain range.[2]
During the last glaciation of the current ice age, all of British Columbia was covered by ice (except Haida Gwaii and Brooks Peninsula).
| Mountain | Height (m) | Mountain | Height (m) |
|---|---|---|---|
| Saint Elias Mountains | Rocky Mountains (cont.) | ||
| Fairweather Mountain (highest point on Alaska–B.C. boundary) | 4,663 | Mount Assiniboine (on Alberta–B.C. boundary) | 3,618 |
| Mount Quincy Adams (on Alaska–B.C. boundary) | 4,133 | Mount Goodsir: North Tower | 3,581 |
| Mount Root (on Alaska–B.C. boundary) | 3,901 | Mount Goodsir: South Tower | 3,520 |
| Coast Mountains | Snow Dome (on Alberta–B.C. boundary) | 3,520 | |
| Mount Waddington | 4,016 | Mount Bryce | 3,507 |
| Mount Tiedemann | 3,848 | Selkirk Mountains | |
| Combatant Mountain | 3,756 | Mount Sir Sandford | 3,522 |
| Asperity Mountain | 3,716 | Cariboo Mountains | |
| Serra Peaks | 3,642 | Mount Sir Wilfrid Laurier | 3,520 |
| Monarch Mountain | 3,459 | Purcell Mountains | |
| Rocky Mountains | Mount Farnham | 3,481 | |
| Mount Robson | 3,954 | Monashee Mountains[3] | |
| Mount Columbia (on Alberta–B.C. boundary) | 3,747 | Mount Monashee | 3,274 |
| Mount Clemenceau | 3,642 | Hallam Peak | 3,205 |
Source Statistics Canada
Volcanoes
Although little-known to the general public, British Columbia is home to a huge area of volcanoes and volcanic activity in the Pacific Ring of Fire.[4] Several mountains that many British Columbians look at every day are dormant volcanoes. Most of them have erupted during the Pleistocene and Holocene. Although none of Canada's volcanoes are currently erupting, several volcanoes, volcanic fields, and volcanic centers are considered potentially active,[5] 49 of which have erupted in the past 10,000 years[5] and many of which have been active in the past two million years. There are hot springs at some volcanoes while 10 volcanoes in British Columbia appear related to seismic activity since 1975, including: Mount Silverthrone, Mount Meager massif, Wells Gray-Clearwater volcanic field, Mount Garibaldi, Mount Cayley, Castle Rock, The Volcano, Mount Edziza, Hoodoo Mountain and Crow Lagoon.[6] Numerous shield volcanoes developed during the Tertiary period in north-central British Columbia and some were active intermittently to recent times. Mount Edziza and Level Mountain are most spectacular examples. Mount Edziza is a stratovolcano consisting of a basal shield of basaltic flows surmounted by a central vent and flanked by numerous satellite cones, ash beds and blocky lavas. The complex has a long history of volcanic eruption that began about 10 million years ago and ended about 1300 years ago. The volcanoes are grouped into four volcanic belts with different tectonic settings.
The Garibaldi Volcanic Belt is a north–south range of volcanoes in southwestern British Columbia. It is the northern extension of the Cascade Volcanic Arc in the United States and contains the most explosive young volcanoes in Canada. It was formed by subduction of the Juan de Fuca Plate at the Cascadia subduction zone. Eruption styles within the belt range from effusive to explosive, with compositions from basalt to rhyolite. The most recent major catastrophic eruption was the 2350 BP eruption of the Mount Meager massif. It produced an ash column at least 20 km high into the stratosphere and dammed the Lillooet River with breccia.
The Anahim Volcanic Belt is an east–west line of volcanoes. These volcanoes probably formed when the North American Plate moved over the Anahim hotspot. The hotspot is considered similar to the one feeding the Hawaiian Islands. The last volcanic eruption within the belt was about 7000 years ago at a small cinder cone called Nazko Cone.
The Northern Cordilleran Volcanic Province (sometimes called the Stikine Volcanic Belt) is the most active volcanic region in Canada, containing more than 100 volcanoes. Several eruptions are known to have occurred within this region in the past 400 years and contains Canada's largest volcanoes. It formed as a result of faulting, cracking, rifting and the interaction between the Pacific and the North American plates.
The Chilcotin Group in southern British Columbia is thought to have formed as a result of back-arc extension behind the Cascadia subduction zone.
The Wells Gray-Clearwater volcanic field in southeastern British Columbia consists of numerous small, basaltic volcanoes and extensive lava flows. Many individual volcanoes in the field have been active for the last 3 million years during which time the region was covered by thick glacial ice at least twice, prior to the well known Fraser Glaciation (also known as the Wisconsin Glaciation). The origin of the volcanism is yet unknown but is probably related to crustal thinning. The last eruption in the field was at Kostal Cone in 1500. Volcanism within the field has also created the 142-metre (465 ft)-high Helmcken Falls, which is the fourth highest waterfall in Canada. It owes its foundation to the deposits of volcanic rock that were placed down in the wide valley of the Murtle River. Layer upon layer of fresh lava created flat areas, over which enormous floods flowed during the last ice age. These floods shaped the upright cliff in the lava flows over which the river now flows. The protection of Helmcken Falls was one of the major causes for the development of Wells Gray Provincial Park. As a result, if it had not been for the volcanic eruptions, it is not likely that such a large wilderness region would have been made.
Water
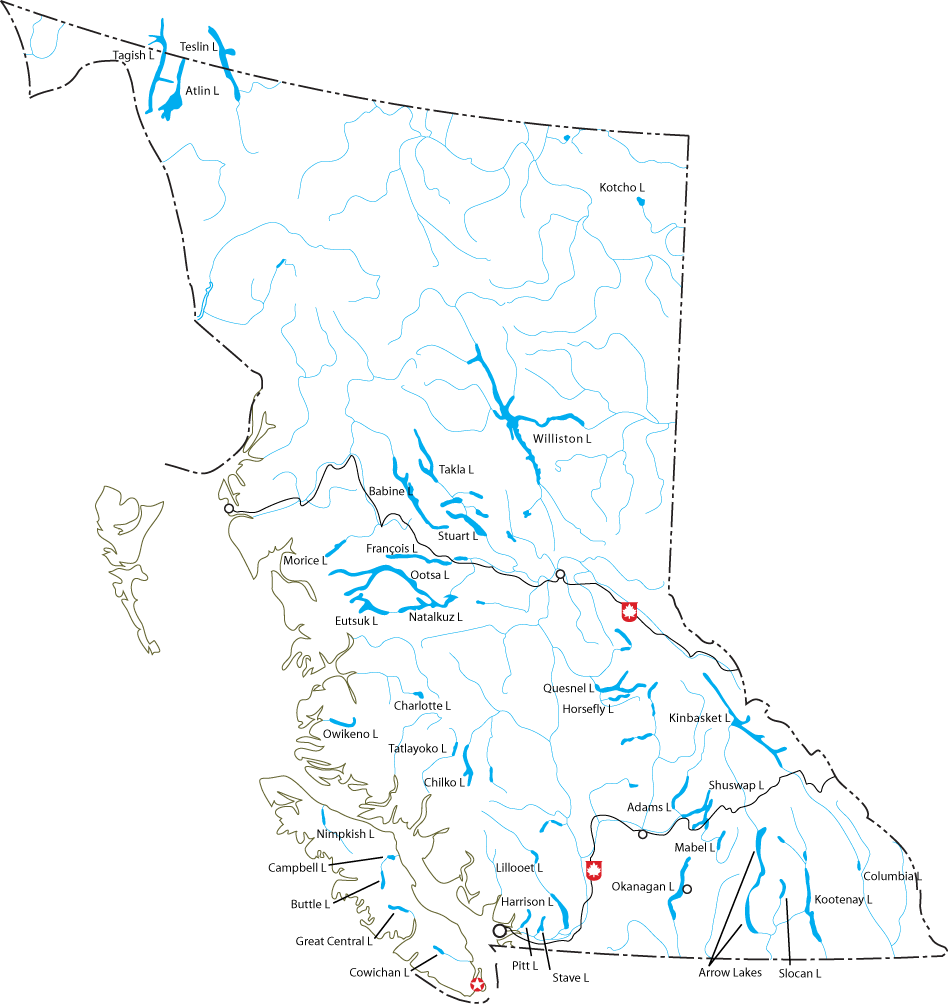
The Fraser River forms an important transportation corridor when it drains much of central and southern British Columbia flowing to the Pacific Ocean. Other major rivers include the upper Columbia River and the Kootenay River. In northern B.C. the Stikine, Nass and Skeena Rivers flow toward the Pacific Ocean, and Peace River flows northeast toward the Arctic Ocean. Hydroelectric resources in B.C. are highly developed, and pulp and paper and lumber mills are common throughout the province. The Fraser, Nass, and Skeena Rivers have not been dammed in order to protect the salmon runs on them. Rivers and their valleys have for a long time provided routes through the mountains for people in B.C.[7]
Long, narrow lakes are found throughout the valleys of the Southern and Central Interior. Among these are Atlin, Kootenay, Okanagan, Quesnel, and Shuswap Lakes. Several high dams have impounded large reservoir lakes like Kinbasket Lake, particularly on the Columbia (see Hydroelectric dams on the Columbia River) and Peace Rivers. Williston Lake, on the Peace River, is the province's largest body of freshwater.
| River | Drainage area (km2) | Length (km) | Discharge (m^3/s) |
|---|---|---|---|
| Columbia (mouth to head of Columbia Lake) | 668,000 | 2,000 | 7,500 |
| (International boundary to head of Columbia Lake) | 102,800 | 801 | 2,800 |
| Kootenay | 37,700 | 780 | 782 |
| Kettle (to head of Holmes Lake) | 4,700 | 336 | 82.2 |
| Okanagan (to head of Okanagan Lake) | 21,600 | 314 | 18.3 |
| Fraser | 232,300 | 1,370 | 3,340 |
| Thompson (to head of North Thompson) | 55,400 | 489 | 772 |
| North Thompson | 20,700 | 338 | 427 |
| South Thompson (to head of Shuswap) | 17,800 | 332 | 292 |
| Nechako (to head of Eutsuk Lake) | 47,100 | 462 | 277 |
| Stuart (to head of Driftwood) | 16,200 | 415 | 131 |
| Skeena | 54,400 | 579 | 911 |
| Stikine | 49,800 | 539 | 1,580 |
| Nass | 21,100 | 380 | 780 |
| Peace (to head of Finlay) | 302,500 | 1,923 | 1,540 |
Source Source Environment Canada
| Lake | Area(km2) | Altitude (m) | Depth(m) | Volume(km3) |
|---|---|---|---|---|
| Williston | 1,761 | 671 | 166 | 70.3 |
| Atlin (including Yukon portion) | 775 | 668 | 283 | 54.0 |
| Sproat | 546 | 29 | 195 | 23.0 |
| Kinbasket | 529 | 754 | 240 | - |
| Babine | 495 | 711 | 180 | 37 |
| Kootenay | 389 | 530 | 154 | 36.7 |
| Ootsa | 404 | 855 | - | - |
| Stuart | 358 | 680 | 95 | 09.6 |
| Okanagan | 351 | 342 | 230 | 24.6 |
| Shuswap | 310 | 347 | 161 | 19.1 |
| Upper Arrow | 301 | - | - | - |
| Eutsuk | 267 | - | 305 | 28.5 |
| Quesnel | 266 | 729 | 600 | 41.8 |
| Takla | 265 | 791 | 287 | 28.4 |
| Francois | 258 | 715 | 244 | 23.1 |
| Harrison | 218 | 10 | 279 | 33 |
| Chilko | 180 | 1172 | 366 | 21.2 |
| Adams | 137 | 404 | 464 | 23.2 |
| Murtle | 76.3 | 1067 | 333 | 08.2 |
| Slocan | 69.3 | 535 | 298 | 11.9 |
| Kennedy | 69.2 | 4 | - | - |
| Charlotte | 66 | 1175 | 101 | 02.7 |
| Mabel | 60 | 396 | 192 | 06.8 |
| Stave | 59 | 81 | 101 | 02.0 |
| Pitt | 58 | 0 | 142.6 | 02.4 |
| Horsefly | 57 | 783 | 191 | 03.9 |
| Canim | 56 | 772 | 209 | 07.2 |
| Bowser | 55.7 | 368 | 119 | - |
| Tahtsa | 53 | 852 | 218 | 03.3 |
| Kamloops | 52 | 335 | 152 | 03.7 |
| Great Central | 50.85 | 82 | 250 | 06.3 |
| Carpenter | 50 | - | - | - |
| Nation | 47 | 1081 | 78 | 01.2 |
| Tatlayoko | 40 | 827 | 210 | 04.3 |
| Meziadan | 37.3 | 305 | 133 | 02.2 |
| Inzana | 36.6 | 880 | 95.4 | 01.3 |
Sources , ,
Climate
Because of the many mountain ranges and rugged coastline, British Columbia's climate varies dramatically across the province.
Coastal southern British Columbia has a mild, rainy oceanic climate, influenced by the North Pacific Current, which has its origins in the Kuroshio Current. Hucuktlis Lake on Vancouver Island receives an average of 6,903 mm (271.8 in) of rain annually, and some parts of the area are even classified as warm-summer Mediterranean, some of the northernmost occurrences in the world. In Victoria, the annual average temperature is 11.2 °C (52.2 °F), the warmest in Canada.[8]
Due to the blocking presence of successive mountain ranges, the climate of some of the interior valleys of the province is semi-arid with certain locations receiving less than 300 mm (12 in) in annual precipitation.[9]
South Coast
The climate of the coast of British Columbia is generally oceanic (Cfb). The winters are very cloudy, cool, and extremely rainy, although generally above freezing, and the summers are cool and comparatively drier with temperatures generally between 16 and 24 °C (61 and 75 °F). Precipitation is generally around 3,000 mm (120 in), falling on around 200 days. Coastal fog develops on many days, especially in winter, with sunshine around 1400 hours a year.
The exception to British Columbia's wet and cloudy winters is during the El Niño phase. During El Niño events, the jet stream is much farther south across North America, making the province's winters milder and drier than normal. Winters are much wetter and cooler during the opposite phase, La Niña.
| Climate data for Port Renfrew Climate ID: 1016335; coordinates 48°35′30″N 124°19′35″W / 48.59167°N 124.32639°W; elevation: 10.0 m (32.8 ft); 1981-2010 normals | |||||||||||||
|---|---|---|---|---|---|---|---|---|---|---|---|---|---|
| Month | Jan | Feb | Mar | Apr | May | Jun | Jul | Aug | Sep | Oct | Nov | Dec | Year |
| Record high °C (°F) | 19.0 (66.2) | 16.5 (61.7) | 20.0 (68.0) | 24.5 (76.1) | 27.5 (81.5) | 31.0 (87.8) | 31.7 (89.1) | 33.5 (92.3) | 28.9 (84.0) | 24.0 (75.2) | 17.2 (63.0) | 15.0 (59.0) | 33.5 (92.3) |
| Average high °C (°F) | 6.3 (43.3) | 7.5 (45.5) | 9.7 (49.5) | 12.3 (54.1) | 15.2 (59.4) | 17.4 (63.3) | 19.4 (66.9) | 20.0 (68.0) | 17.8 (64.0) | 12.9 (55.2) | 8.5 (47.3) | 5.9 (42.6) | 12.7 (54.9) |
| Daily mean °C (°F) | 4.1 (39.4) | 4.6 (40.3) | 6.2 (43.2) | 8.4 (47.1) | 11.1 (52.0) | 13.4 (56.1) | 15.3 (59.5) | 15.6 (60.1) | 13.4 (56.1) | 9.6 (49.3) | 6.1 (43.0) | 3.8 (38.8) | 9.3 (48.7) |
| Average low °C (°F) | 1.8 (35.2) | 1.6 (34.9) | 2.7 (36.9) | 4.3 (39.7) | 6.9 (44.4) | 9.4 (48.9) | 11.0 (51.8) | 11.1 (52.0) | 9.0 (48.2) | 6.3 (43.3) | 3.7 (38.7) | 1.6 (34.9) | 5.8 (42.4) |
| Record low °C (°F) | −12.5 (9.5) | −10.5 (13.1) | −6.7 (19.9) | −2.5 (27.5) | 0.0 (32.0) | 1.7 (35.1) | 5.0 (41.0) | 2.2 (36.0) | −0.6 (30.9) | −3.5 (25.7) | −11.5 (11.3) | −11.1 (12.0) | −12.5 (9.5) |
| Average precipitation mm (inches) | 555.7 (21.88) | 376.6 (14.83) | 362.3 (14.26) | 258.7 (10.19) | 154.7 (6.09) | 107.9 (4.25) | 50.5 (1.99) | 82.4 (3.24) | 123.9 (4.88) | 371.2 (14.61) | 579.7 (22.82) | 481.0 (18.94) | 3,504.6 (137.98) |
| Average rainfall mm (inches) | 544.0 (21.42) | 362.0 (14.25) | 356.0 (14.02) | 258.1 (10.16) | 154.6 (6.09) | 107.9 (4.25) | 50.5 (1.99) | 82.4 (3.24) | 123.9 (4.88) | 371.0 (14.61) | 575.4 (22.65) | 468.9 (18.46) | 3,454.7 (136.01) |
| Average snowfall cm (inches) | 11.8 (4.6) | 14.6 (5.7) | 6.3 (2.5) | 0.6 (0.2) | 0.1 (0.0) | 0.0 (0.0) | 0.0 (0.0) | 0.0 (0.0) | 0.0 (0.0) | 0.2 (0.1) | 4.3 (1.7) | 12.1 (4.8) | 50.0 (19.7) |
| Average precipitation days (≥ 0.2 mm) | 22.8 | 18.4 | 22.3 | 19.3 | 16.7 | 13.9 | 9.0 | 9.6 | 11.1 | 18.8 | 23.1 | 22.4 | 207.3 |
| Average rainy days (≥ 0.2 mm) | 22.1 | 17.8 | 22.0 | 19.3 | 16.7 | 13.9 | 9.0 | 9.6 | 11.1 | 18.8 | 22.8 | 21.5 | 204.7 |
| Average snowy days (≥ 0.2 cm) | 2.9 | 2.2 | 2.0 | 0.33 | 0.04 | 0.0 | 0.0 | 0.0 | 0.0 | 0.08 | 1.0 | 2.5 | 11.1 |
| Source: Environment and Climate Change Canada[10] | |||||||||||||
Lower Mainland
Like regions of San Francisco and southern California, the Lower Mainland exhibits a variety of microclimates.[11] Here, the winters are cloudy, cool, and rainy, while the summers are varied across the region. For example, Delta on the southwest tip of the region has summer highs of 21 °C (70 °F), while inland regions like Abbotsford and Chilliwack have summers up to 25 °C (77 °F) and occasionally above 30 °C (86 °F). Precipitation is between 900 and 2,000 mm (35 and 79 in). Sunshine ranges from 1500 to 2000 hours.
| Climate data for Richmond (Vancouver International Airport) Climate ID: 1108447; coordinates 49°11′42″N 123°10′55″W / 49.19500°N 123.18194°W; elevation: 4.3 m (14 ft); 1981-2010 normals, extremes 1898–present[a] | |||||||||||||
|---|---|---|---|---|---|---|---|---|---|---|---|---|---|
| Month | Jan | Feb | Mar | Apr | May | Jun | Jul | Aug | Sep | Oct | Nov | Dec | Year |
| Record high humidex | 17.2 | 18.0 | 20.3 | 23.9 | 33.7 | 38.4 | 38.3 | 35.9 | 33.0 | 27.2 | 21.1 | 16.1 | 38.4 |
| Record high °C (°F) | 15.3 (59.5) | 18.4 (65.1) | 20.0 (68.0) | 26.1 (79.0) | 30.4 (86.7) | 33.3 (91.9) | 34.4 (93.9) | 33.3 (91.9) | 30.0 (86.0) | 25.0 (77.0) | 23.3 (73.9) | 15.0 (59.0) | 34.4 (93.9) |
| Average high °C (°F) | 6.9 (44.4) | 8.2 (46.8) | 10.3 (50.5) | 13.2 (55.8) | 16.7 (62.1) | 19.6 (67.3) | 22.2 (72.0) | 22.2 (72.0) | 18.9 (66.0) | 13.5 (56.3) | 9.2 (48.6) | 6.3 (43.3) | 13.9 (57.0) |
| Daily mean °C (°F) | 4.1 (39.4) | 4.9 (40.8) | 6.9 (44.4) | 9.4 (48.9) | 12.8 (55.0) | 15.7 (60.3) | 18.0 (64.4) | 18.0 (64.4) | 14.9 (58.8) | 10.3 (50.5) | 6.3 (43.3) | 3.6 (38.5) | 10.4 (50.7) |
| Average low °C (°F) | 1.4 (34.5) | 1.6 (34.9) | 3.4 (38.1) | 5.6 (42.1) | 8.8 (47.8) | 11.7 (53.1) | 13.7 (56.7) | 13.8 (56.8) | 10.8 (51.4) | 7.0 (44.6) | 3.5 (38.3) | 0.8 (33.4) | 6.8 (44.2) |
| Record low °C (°F) | −17.8 (0.0) | −16.1 (3.0) | −9.4 (15.1) | −3.3 (26.1) | 0.6 (33.1) | 3.9 (39.0) | 6.1 (43.0) | 3.9 (39.0) | −1.1 (30.0) | −6.1 (21.0) | −14.3 (6.3) | −17.8 (0.0) | −17.8 (0.0) |
| Record low wind chill | −22.6 | −21.2 | −14.5 | −5.4 | 0.0 | 0.0 | 0.0 | 0.0 | 0.0 | −11.4 | −21.3 | −27.8 | −27.8 |
| Average precipitation mm (inches) | 168.4 (6.63) | 104.6 (4.12) | 113.9 (4.48) | 88.5 (3.48) | 65.0 (2.56) | 53.8 (2.12) | 35.6 (1.40) | 36.7 (1.44) | 50.9 (2.00) | 120.8 (4.76) | 188.9 (7.44) | 161.9 (6.37) | 1,189 (46.81) |
| Average rainfall mm (inches) | 157.5 (6.20) | 98.9 (3.89) | 111.8 (4.40) | 88.1 (3.47) | 65.0 (2.56) | 53.8 (2.12) | 35.6 (1.40) | 36.7 (1.44) | 50.9 (2.00) | 120.7 (4.75) | 185.8 (7.31) | 148.3 (5.84) | 1,153.1 (45.38) |
| Average snowfall cm (inches) | 11.1 (4.4) | 6.3 (2.5) | 2.3 (0.9) | 0.3 (0.1) | 0.0 (0.0) | 0.0 (0.0) | 0.0 (0.0) | 0.0 (0.0) | 0.0 (0.0) | 0.1 (0.0) | 3.2 (1.3) | 14.8 (5.8) | 38.1 (15.0) |
| Average precipitation days (≥ 0.2 mm) | 19.5 | 15.4 | 17.7 | 14.8 | 13.2 | 11.5 | 6.3 | 6.7 | 8.3 | 15.4 | 20.4 | 19.7 | 168.9 |
| Average rainy days (≥ 0.2 mm) | 18.4 | 14.7 | 17.5 | 14.8 | 13.2 | 11.5 | 6.3 | 6.8 | 8.3 | 15.4 | 19.9 | 18.4 | 165.2 |
| Average snowy days (≥ 0.2 cm) | 2.6 | 1.4 | 0.9 | 0.2 | 0.0 | 0.0 | 0.0 | 0.0 | 0.0 | 0.03 | 0.8 | 2.8 | 8.73 |
| Average relative humidity (%) | 81.2 | 74.5 | 70.1 | 65.4 | 63.5 | 62.2 | 61.4 | 61.8 | 67.2 | 75.6 | 79.5 | 80.9 | 70.3 |
| Mean monthly sunshine hours | 60.2 | 91.0 | 134.8 | 185.0 | 222.5 | 226.9 | 289.8 | 277.1 | 212.8 | 120.7 | 60.4 | 56.5 | 1,937.5 |
| Percent possible sunshine | 22.3 | 31.8 | 36.6 | 45.0 | 46.9 | 46.8 | 59.3 | 62.1 | 56.1 | 36.0 | 21.9 | 22.0 | 40.6 |
| Average ultraviolet index | 1 | 1 | 3 | 4 | 6 | 6 | 7 | 6 | 4 | 2 | 1 | 1 | 4 |
| Source 1: Environment and Climate Change Canada[14][15][16][17][18][19][20][21][22][23][24][25][26] | |||||||||||||
| Source 2: Weather Atlas(UV)[27] | |||||||||||||
Southwest Interior
Here, the winters are comparatively colder, with temperatures between −5 and 4 °C (23 and 39 °F), but still very mild for inland locations. Conversely, summer temperatures are the highest in Canada, generally between 27 and 40.5 °C (80.6 and 104.9 °F). Regional averages range from 26 °C (79 °F) in higher elevations up to 32 °C (90 °F) in Osoyoos, which has the hottest daytime high temperature in Canada. Although the days are hot, the humidity is low and nights are very cool, reaching 15 °C (59 °F) in summer. These regions are typically very dry, with some regions receiving less than 300 mm (12 in) on around 100 days, strongly contrasting with some of the wettest regions in the world on the coast. In spite of the arid climate, temperature inversions are often created in winter which reduces sunshine to just 1700 to 2000 hours a year, exceptionally little for the dryness.
| Climate data for Downtown Osoyoos (Osoyoos CS) WMO ID: 71215; coordinates 49°01′42″N 119°26′28″W / 49.02833°N 119.44111°W; elevation: 282.9 m (928 ft); 1981–2010 normals, extremes 1954–present[b] | |||||||||||||
|---|---|---|---|---|---|---|---|---|---|---|---|---|---|
| Month | Jan | Feb | Mar | Apr | May | Jun | Jul | Aug | Sep | Oct | Nov | Dec | Year |
| Record high humidex | 11.2 | 16.0 | 25.0 | 29.0 | 36.2 | 49.0 | 46.5 | 45.3 | 39.0 | 30.2 | 19.4 | 14.5 | 49.0 |
| Record high °C (°F) | 17.5 (63.5) | 17.0 (62.6) | 25.4 (77.7) | 32.8 (91.0) | 36.1 (97.0) | 45.0 (113.0) | 42.8 (109.0) | 41.7 (107.1) | 37.5 (99.5) | 28.9 (84.0) | 21.1 (70.0) | 18.1 (64.6) | 45.0 (113.0) |
| Average high °C (°F) | 2.0 (35.6) | 6.7 (44.1) | 12.5 (54.5) | 18.1 (64.6) | 23.1 (73.6) | 26.8 (80.2) | 31.5 (88.7) | 31.1 (88.0) | 25.6 (78.1) | 16.4 (61.5) | 7.1 (44.8) | 2.0 (35.6) | 17.0 (62.6) |
| Daily mean °C (°F) | −0.9 (30.4) | 1.9 (35.4) | 6.6 (43.9) | 10.9 (51.6) | 15.6 (60.1) | 19.2 (66.6) | 22.9 (73.2) | 22.3 (72.1) | 17.3 (63.1) | 10.0 (50.0) | 3.4 (38.1) | −0.7 (30.7) | 10.7 (51.3) |
| Average low °C (°F) | −3.8 (25.2) | −2.9 (26.8) | −0.3 (31.5) | 3.6 (38.5) | 7.9 (46.2) | 11.6 (52.9) | 14.3 (57.7) | 13.5 (56.3) | 8.9 (48.0) | 3.5 (38.3) | −0.6 (30.9) | −3.5 (25.7) | 4.3 (39.7) |
| Record low °C (°F) | −26.1 (−15.0) | −22.0 (−7.6) | −17.8 (0.0) | −6.7 (19.9) | −3.9 (25.0) | 0.6 (33.1) | 5.6 (42.1) | 4.0 (39.2) | −2.2 (28.0) | −9.8 (14.4) | −22.5 (−8.5) | −26.1 (−15.0) | −26.1 (−15.0) |
| Record low wind chill | −28 | −25 | −20 | −8 | −2 | 0 | 0 | 0 | −2 | −11 | −25 | −26 | −28 |
| Average precipitation mm (inches) | 28.8 (1.13) | 22.3 (0.88) | 24.0 (0.94) | 24.2 (0.95) | 37.1 (1.46) | 41.7 (1.64) | 24.6 (0.97) | 17.3 (0.68) | 14.9 (0.59) | 18.6 (0.73) | 33.8 (1.33) | 35.8 (1.41) | 323.2 (12.72) |
| Average rainfall mm (inches) | 14.3 (0.56) | 17.7 (0.70) | 22.3 (0.88) | 24.1 (0.95) | 37.1 (1.46) | 41.7 (1.64) | 24.6 (0.97) | 17.3 (0.68) | 14.9 (0.59) | 18.5 (0.73) | 28.2 (1.11) | 18.8 (0.74) | 279.4 (11.00) |
| Average snowfall cm (inches) | 14.6 (5.7) | 4.6 (1.8) | 1.7 (0.7) | 0.1 (0.0) | 0.0 (0.0) | 0.0 (0.0) | 0.0 (0.0) | 0.0 (0.0) | 0.0 (0.0) | 0.1 (0.0) | 5.7 (2.2) | 17.0 (6.7) | 43.8 (17.2) |
| Average precipitation days (≥ 0.2 mm) | 12.0 | 9.2 | 9.9 | 9.7 | 10.4 | 10.2 | 6.7 | 5.5 | 5.2 | 7.8 | 12.2 | 12.3 | 111.1 |
| Average rainy days (≥ 0.2 mm) | 6.0 | 6.9 | 9.2 | 9.6 | 10.4 | 10.2 | 6.7 | 5.5 | 5.2 | 7.7 | 10.2 | 5.6 | 93.4 |
| Average snowy days (≥ 0.2 cm) | 6.7 | 2.7 | 1.1 | 0.1 | 0.0 | 0.0 | 0.0 | 0.0 | 0.0 | 0.1 | 2.7 | 7.6 | 20.9 |
| Average afternoon relative humidity (%) | 73.0 | 58.3 | 42.7 | 33.9 | 34.4 | 35.5 | 28.8 | 30.4 | 36.1 | 47.8 | 65.5 | 73.1 | 46.6 |
| Source: Environment and Climate Change Canada[28][29][30][31][32][33][34][35] | |||||||||||||
Southeast Interior
This region, situated further to the east, typically has similar weather to the southwest interior, although with cooler and wetter conditions due to orographic lift and higher elevation. The winters are between −15 and 2 °C (5 and 36 °F), while the summers are 23 to 31 °C (73 to 88 °F).
| Climate data for Castlegar (West Kootenay Regional Airport) Climate ID: 1141455; coordinates 49°17′47″N 117°37′57″W / 49.29639°N 117.63250°W; elevation: 495.6 m (1,626 ft); 1981–2010 normals, extremes 1916–present[c] | |||||||||||||
|---|---|---|---|---|---|---|---|---|---|---|---|---|---|
| Month | Jan | Feb | Mar | Apr | May | Jun | Jul | Aug | Sep | Oct | Nov | Dec | Year |
| Record high humidex | 9.0 | 14.1 | 22.6 | 27.7 | 35.9 | 46.9 | 53.4 | 42.8 | 37.9 | 28.2 | 19.2 | 10.6 | 53.4 |
| Record high °C (°F) | 10.0 (50.0) | 14.3 (57.7) | 23.1 (73.6) | 32.2 (90.0) | 34.5 (94.1) | 43.9 (111.0) | 41.1 (106.0) | 40.0 (104.0) | 36.8 (98.2) | 27.2 (81.0) | 19.4 (66.9) | 11.7 (53.1) | 43.9 (111.0) |
| Average high °C (°F) | 0.5 (32.9) | 3.2 (37.8) | 9.4 (48.9) | 15.3 (59.5) | 20.0 (68.0) | 23.6 (74.5) | 28.1 (82.6) | 28.2 (82.8) | 22.0 (71.6) | 12.9 (55.2) | 4.7 (40.5) | 0.0 (32.0) | 14.0 (57.2) |
| Daily mean °C (°F) | −1.6 (29.1) | −0.1 (31.8) | 4.4 (39.9) | 8.8 (47.8) | 13.3 (55.9) | 16.8 (62.2) | 20.2 (68.4) | 20.0 (68.0) | 14.7 (58.5) | 8.0 (46.4) | 2.1 (35.8) | −2.1 (28.2) | 8.7 (47.7) |
| Average low °C (°F) | −3.7 (25.3) | −3.5 (25.7) | −0.7 (30.7) | 2.3 (36.1) | 6.5 (43.7) | 10.0 (50.0) | 12.2 (54.0) | 11.7 (53.1) | 7.3 (45.1) | 3.0 (37.4) | −0.6 (30.9) | −4.2 (24.4) | 3.4 (38.1) |
| Record low °C (°F) | −25.7 (−14.3) | −25.0 (−13.0) | −18.3 (−0.9) | −10.0 (14.0) | −3.9 (25.0) | −1.1 (30.0) | 3.3 (37.9) | 0.0 (32.0) | −7.8 (18.0) | −11.3 (11.7) | −20.2 (−4.4) | −30.6 (−23.1) | −30.6 (−23.1) |
| Record low wind chill | −32 | −33 | −28 | −9 | −4 | −7 | 0 | 0 | −5 | −19 | −30 | −42 | −42 |
| Average precipitation mm (inches) | 75.5 (2.97) | 51.2 (2.02) | 62.9 (2.48) | 59.3 (2.33) | 70.3 (2.77) | 72.3 (2.85) | 48.1 (1.89) | 30.4 (1.20) | 42.4 (1.67) | 51.3 (2.02) | 96.7 (3.81) | 90.3 (3.56) | 750.9 (29.56) |
| Average rainfall mm (inches) | 26.2 (1.03) | 28.1 (1.11) | 50.1 (1.97) | 57.1 (2.25) | 70.1 (2.76) | 72.3 (2.85) | 48.1 (1.89) | 30.4 (1.20) | 42.4 (1.67) | 49.4 (1.94) | 58.7 (2.31) | 31.3 (1.23) | 564.3 (22.22) |
| Average snowfall cm (inches) | 55.4 (21.8) | 25.7 (10.1) | 13.2 (5.2) | 2.0 (0.8) | 0.2 (0.1) | 0 (0) | 0 (0) | 0 (0) | 0 (0) | 1.9 (0.7) | 37.5 (14.8) | 64.8 (25.5) | 200.6 (79.0) |
| Average precipitation days (≥ 0.2 mm) | 16.5 | 13.4 | 14.5 | 14.4 | 15.5 | 14.4 | 9.7 | 7.7 | 8.2 | 12.1 | 17.4 | 16.6 | 160.3 |
| Average rainy days (≥ 0.2 mm) | 7.8 | 8.1 | 12.4 | 14.2 | 15.5 | 14.4 | 9.7 | 7.7 | 8.2 | 12.0 | 13.0 | 5.7 | 128.5 |
| Average snowy days (≥ 0.2 cm) | 12.6 | 8.6 | 4.9 | 1.2 | 0.2 | 0 | 0 | 0 | 0 | 0.7 | 8.2 | 14.5 | 50.7 |
| Average relative humidity (%) (at 3pm) | 76.0 | 66.6 | 52.5 | 42.8 | 43.7 | 45.7 | 37.3 | 35.0 | 42.6 | 58.1 | 74.6 | 77.7 | 54.4 |
| Mean monthly sunshine hours | 38.9 | 76.1 | 128.8 | 173.8 | 226.7 | 233.0 | 291.9 | 276.3 | 204.0 | 123.2 | 48.2 | 33.4 | 1,854.2 |
| Percent possible sunshine | 14.4 | 26.7 | 35.0 | 42.3 | 47.8 | 48.0 | 59.6 | 61.9 | 53.8 | 36.8 | 17.5 | 13.0 | 38.1 |
| Source: Environment and Climate Change Canada[36][37] | |||||||||||||
Cariboo
This region typically has cooler weather due to increased latitude and altitude, but is still generally warmer than much of Canada at similar latitudes. Here, the winters are between −20 and 0 °C (−4 and 32 °F), while summers are between 18 and 25 °C (64 and 77 °F).
| Climate data for Prince George (Prince George Airport) WMO ID: 71896; coordinates 53°53′27″N 112°40′44″W / 53.89083°N 112.67889°W; elevation: 691.3 m (2,268 ft); 1981–2010 normals, extremes 1942–present | |||||||||||||
|---|---|---|---|---|---|---|---|---|---|---|---|---|---|
| Month | Jan | Feb | Mar | Apr | May | Jun | Jul | Aug | Sep | Oct | Nov | Dec | Year |
| Record high humidex | 12.8 | 12.2 | 18.5 | 29.2 | 35.3 | 38.4 | 37.3 | 36.1 | 32.7 | 25.1 | 16.6 | 10.9 | 38.4 |
| Record high °C (°F) | 12.8 (55.0) | 12.8 (55.0) | 19.9 (67.8) | 29.7 (85.5) | 36.0 (96.8) | 38.4 (101.1) | 35.6 (96.1) | 33.4 (92.1) | 31.4 (88.5) | 25.2 (77.4) | 18.8 (65.8) | 11.7 (53.1) | 38.4 (101.1) |
| Average high °C (°F) | −4.0 (24.8) | −0.4 (31.3) | 5.2 (41.4) | 11.2 (52.2) | 16.7 (62.1) | 20.2 (68.4) | 22.4 (72.3) | 22.0 (71.6) | 16.7 (62.1) | 9.4 (48.9) | 1.0 (33.8) | −3.5 (25.7) | 9.7 (49.5) |
| Daily mean °C (°F) | −7.9 (17.8) | −5.0 (23.0) | −0.2 (31.6) | 5.0 (41.0) | 10.1 (50.2) | 13.8 (56.8) | 15.8 (60.4) | 15.0 (59.0) | 10.4 (50.7) | 4.5 (40.1) | −2.5 (27.5) | −7.2 (19.0) | 4.3 (39.7) |
| Average low °C (°F) | −11.7 (10.9) | −9.6 (14.7) | −5.6 (21.9) | −1.1 (30.0) | 3.4 (38.1) | 7.3 (45.1) | 9.1 (48.4) | 8.0 (46.4) | 4.0 (39.2) | −0.5 (31.1) | −5.9 (21.4) | −10.9 (12.4) | −1.1 (30.0) |
| Record low °C (°F) | −50.0 (−58.0) | −45.0 (−49.0) | −37.8 (−36.0) | −25.6 (−14.1) | −8.3 (17.1) | −2.8 (27.0) | −1.7 (28.9) | −3.9 (25.0) | −12.2 (10.0) | −26.5 (−15.7) | −41.7 (−43.1) | −45.6 (−50.1) | −50.0 (−58.0) |
| Record low wind chill | −51.5 | −50.7 | −46.0 | −32.9 | −12.5 | −4.6 | 0.0 | −3.5 | −11.5 | −31.8 | −48.2 | −49.4 | −51.5 |
| Average precipitation mm (inches) | 52.9 (2.08) | 29.5 (1.16) | 29.7 (1.17) | 36.0 (1.42) | 49.0 (1.93) | 65.3 (2.57) | 62.1 (2.44) | 51.5 (2.03) | 56.3 (2.22) | 63.3 (2.49) | 55.3 (2.18) | 43.9 (1.73) | 594.9 (23.42) |
| Average rainfall mm (inches) | 8.1 (0.32) | 6.7 (0.26) | 12.0 (0.47) | 28.9 (1.14) | 47.2 (1.86) | 65.3 (2.57) | 62.1 (2.44) | 51.5 (2.03) | 55.9 (2.20) | 56.5 (2.22) | 23.9 (0.94) | 5.6 (0.22) | 423.6 (16.68) |
| Average snowfall cm (inches) | 54.6 (21.5) | 28.1 (11.1) | 20.8 (8.2) | 7.4 (2.9) | 1.9 (0.7) | 0.0 (0.0) | 0.0 (0.0) | 0.0 (0.0) | 0.3 (0.1) | 7.9 (3.1) | 36.2 (14.3) | 47.7 (18.8) | 205.1 (80.7) |
| Average precipitation days (≥ 0.2 mm) | 15.2 | 11.7 | 11.3 | 10.3 | 13.5 | 15.2 | 14.3 | 13.1 | 12.6 | 15.8 | 15.6 | 14.3 | 162.9 |
| Average rainy days (≥ 0.2 mm) | 3.2 | 3.6 | 5.7 | 8.6 | 13.1 | 15.2 | 14.3 | 13.1 | 12.6 | 14.6 | 7.0 | 2.6 | 113.5 |
| Average snowy days (≥ 0.2 cm) | 14.0 | 9.9 | 7.9 | 3.3 | 1.0 | 0.0 | 0.0 | 0.0 | 0.2 | 2.6 | 11.3 | 13.3 | 63.4 |
| Average relative humidity (%) | 77.4 | 66.2 | 52.1 | 42.4 | 41.2 | 45.7 | 46.8 | 46.5 | 51.5 | 61.5 | 76.8 | 78.9 | 57.3 |
| Mean monthly sunshine hours | 49.0 | 84.0 | 153.5 | 204.6 | 247.5 | 251.0 | 286.2 | 261.8 | 177.7 | 108.0 | 51.2 | 43.6 | 1,918.1 |
| Percent possible sunshine | 19.7 | 30.5 | 41.8 | 48.7 | 50.1 | 49.2 | 55.8 | 56.9 | 46.5 | 32.9 | 19.8 | 18.7 | 39.2 |
| Source: Environment and Climate Change Canada[38] | |||||||||||||
North Coast
The North Coast of British Columbia typically has winters that are remarkably similar to the southern Coast, but with much cooler summers between 13 and 20 °C (55 and 68 °F). It is also very wet, with 1,500 to 4,500 mm (59 to 177 in) of precipitation a year falling on around 230 days. The North Coast is one of the cloudiest places in Canada, with Stewart, British Columbia having only 985 hours of sun a year.[39]
| Climate data for Prince Rupert (Prince Rupert Airport) Climate ID: 1066481; coordinates 54°17′33″N 130°26′41″W / 54.29250°N 130.44472°W; elevation: 35.4 m (116 ft); 1981–2010 normals, extremes 1908–present[d] | |||||||||||||
|---|---|---|---|---|---|---|---|---|---|---|---|---|---|
| Month | Jan | Feb | Mar | Apr | May | Jun | Jul | Aug | Sep | Oct | Nov | Dec | Year |
| Record high humidex | 17.2 | 18.6 | 17.9 | 22.8 | 29.3 | 27.8 | 29.1 | 31.6 | 28.5 | 23.4 | 19.3 | 16.1 | 31.6 |
| Record high °C (°F) | 17.8 (64.0) | 18.9 (66.0) | 20.0 (68.0) | 25.5 (77.9) | 29.4 (84.9) | 32.2 (90.0) | 30.6 (87.1) | 30.0 (86.0) | 27.0 (80.6) | 21.7 (71.1) | 20.0 (68.0) | 18.9 (66.0) | 32.2 (90.0) |
| Average high °C (°F) | 5.6 (42.1) | 6.1 (43.0) | 7.7 (45.9) | 10.2 (50.4) | 12.6 (54.7) | 14.7 (58.5) | 16.2 (61.2) | 17.0 (62.6) | 14.9 (58.8) | 11.1 (52.0) | 7.3 (45.1) | 5.5 (41.9) | 10.8 (51.4) |
| Daily mean °C (°F) | 2.4 (36.3) | 2.7 (36.9) | 4.2 (39.6) | 6.4 (43.5) | 9.0 (48.2) | 11.6 (52.9) | 13.4 (56.1) | 13.8 (56.8) | 11.5 (52.7) | 8.0 (46.4) | 4.3 (39.7) | 2.7 (36.9) | 7.5 (45.5) |
| Average low °C (°F) | −0.8 (30.6) | −0.7 (30.7) | 0.6 (33.1) | 2.5 (36.5) | 5.4 (41.7) | 8.4 (47.1) | 10.5 (50.9) | 10.6 (51.1) | 8.0 (46.4) | 4.9 (40.8) | 1.3 (34.3) | −0.2 (31.6) | 4.2 (39.6) |
| Record low °C (°F) | −24.4 (−11.9) | −18.1 (−0.6) | −17.2 (1.0) | −7.1 (19.2) | −3.7 (25.3) | 1.1 (34.0) | 2.8 (37.0) | 2.8 (37.0) | −2.2 (28.0) | −11.3 (11.7) | −20.6 (−5.1) | −22.8 (−9.0) | −24.4 (−11.9) |
| Record low wind chill | −34 | −25 | −23 | −11 | −5 | −1 | 1 | 0 | −6 | −17 | −28 | −31 | −34 |
| Average precipitation mm (inches) | 276.3 (10.88) | 185.6 (7.31) | 199.6 (7.86) | 172.4 (6.79) | 137.6 (5.42) | 108.8 (4.28) | 118.7 (4.67) | 169.1 (6.66) | 266.3 (10.48) | 373.6 (14.71) | 317.0 (12.48) | 294.2 (11.58) | 2,619.1 (103.11) |
| Average rainfall mm (inches) | 252.9 (9.96) | 167.1 (6.58) | 188.4 (7.42) | 169.6 (6.68) | 137.5 (5.41) | 108.7 (4.28) | 118.7 (4.67) | 169.1 (6.66) | 266.3 (10.48) | 373.4 (14.70) | 306.9 (12.08) | 271.7 (10.70) | 2,530.4 (99.62) |
| Average snowfall cm (inches) | 25.6 (10.1) | 19.3 (7.6) | 11.8 (4.6) | 2.8 (1.1) | 0.1 (0.0) | 0.0 (0.0) | 0.0 (0.0) | 0.0 (0.0) | 0.0 (0.0) | 0.3 (0.1) | 9.7 (3.8) | 22.8 (9.0) | 92.4 (36.4) |
| Average precipitation days (≥ 0.2 mm) | 22.5 | 18.5 | 21.7 | 19.6 | 18.3 | 17.3 | 17.5 | 17.5 | 19.8 | 24.2 | 23.8 | 22.8 | 243.5 |
| Average rainy days (≥ 0.2 mm) | 20.4 | 16.4 | 20.3 | 19.4 | 18.3 | 17.3 | 17.5 | 17.5 | 19.8 | 24.2 | 23.4 | 21.5 | 235.9 |
| Average snowy days (≥ 0.2 cm) | 5.0 | 4.2 | 3.6 | 1.2 | 0.08 | 0.0 | 0.0 | 0.0 | 0.04 | 0.20 | 2.9 | 4.6 | 21.7 |
| Average relative humidity (%) (at 3pm) | 78.5 | 71.5 | 68.1 | 67.7 | 71.2 | 75.0 | 77.6 | 77.7 | 76.1 | 77.5 | 77.6 | 80.2 | 74.9 |
| Mean monthly sunshine hours | 40.1 | 65.2 | 103.0 | 145.8 | 171.1 | 154.5 | 149.7 | 149.7 | 115.7 | 72.4 | 43.0 | 32.1 | 1,242.1 |
| Percent possible sunshine | 16.2 | 23.8 | 28.1 | 34.6 | 34.5 | 30.1 | 29.1 | 32.4 | 30.2 | 22.1 | 16.7 | 13.9 | 26.0 |
| Source: Environment and Climate Change Canada[40][41][42][43][44][45][46][47] | |||||||||||||
Northeast
The northeast of the province is the only region east of the Rocky Mountains, causing conditions similar to the rest of Canada and similar to neighbouring Alberta. Winters are −10 to −30 °C (14 to −22 °F) while summers are 18 to 26 °C (64 to 79 °F).
| Climate data for Fort St. John (Fort St. John Airport) WMO ID: 71943; coordinates 56°14′17″N 120°44′25″W / 56.23806°N 120.74028°W; elevation: 694.9 m (2,280 ft); 1981–2010 normals, extremes 1910–present[e] | |||||||||||||
|---|---|---|---|---|---|---|---|---|---|---|---|---|---|
| Month | Jan | Feb | Mar | Apr | May | Jun | Jul | Aug | Sep | Oct | Nov | Dec | Year |
| Record high humidex | 12.7 | 12.4 | 17.3 | 27.4 | 31.5 | 34.3 | 37.4 | 34.5 | 32.6 | 25.4 | 16.2 | 11.2 | 37.4 |
| Record high °C (°F) | 12.9 (55.2) | 15.0 (59.0) | 18.0 (64.4) | 28.5 (83.3) | 32.2 (90.0) | 31.7 (89.1) | 38.3 (100.9) | 33.6 (92.5) | 32.2 (90.0) | 26.7 (80.1) | 18.3 (64.9) | 15.0 (59.0) | 38.3 (100.9) |
| Average high °C (°F) | −8.7 (16.3) | −5.1 (22.8) | 0.1 (32.2) | 9.1 (48.4) | 15.5 (59.9) | 19.6 (67.3) | 21.7 (71.1) | 20.5 (68.9) | 15.2 (59.4) | 7.7 (45.9) | −2.9 (26.8) | −7.4 (18.7) | 7.1 (44.8) |
| Daily mean °C (°F) | −12.8 (9.0) | −9.6 (14.7) | −4.6 (23.7) | 3.9 (39.0) | 9.8 (49.6) | 14.1 (57.4) | 16.2 (61.2) | 14.9 (58.8) | 10.1 (50.2) | 3.6 (38.5) | −6.6 (20.1) | −11.4 (11.5) | 2.3 (36.1) |
| Average low °C (°F) | −16.9 (1.6) | −14.0 (6.8) | −9.2 (15.4) | −1.3 (29.7) | 4.0 (39.2) | 8.6 (47.5) | 10.7 (51.3) | 9.2 (48.6) | 4.9 (40.8) | −0.6 (30.9) | −10.2 (13.6) | −15.3 (4.5) | −2.5 (27.5) |
| Record low °C (°F) | −53.9 (−65.0) | −50.0 (−58.0) | −37.8 (−36.0) | −31.1 (−24.0) | −13.1 (8.4) | −5.6 (21.9) | −4.4 (24.1) | −2.9 (26.8) | −12.8 (9.0) | −25.0 (−13.0) | −39.2 (−38.6) | −50.6 (−59.1) | −53.9 (−65.0) |
| Record low wind chill | −59.5 | −59.3 | −48.7 | −37.8 | −19.9 | −6.2 | 0.0 | −7.8 | −18.4 | −35.3 | −58.3 | −53.9 | −59.5 |
| Average precipitation mm (inches) | 25.4 (1.00) | 19.0 (0.75) | 23.7 (0.93) | 20.0 (0.79) | 37.9 (1.49) | 65.6 (2.58) | 75.2 (2.96) | 51.2 (2.02) | 44.7 (1.76) | 30.8 (1.21) | 29.2 (1.15) | 22.0 (0.87) | 444.7 (17.51) |
| Average rainfall mm (inches) | 0.4 (0.02) | 0.4 (0.02) | 0.7 (0.03) | 9.7 (0.38) | 31.9 (1.26) | 65.6 (2.58) | 75.2 (2.96) | 51.1 (2.01) | 40.0 (1.57) | 13.3 (0.52) | 3.4 (0.13) | 0.7 (0.03) | 292.4 (11.51) |
| Average snowfall cm (inches) | 32.7 (12.9) | 25.3 (10.0) | 28.7 (11.3) | 12.7 (5.0) | 6.4 (2.5) | 0.0 (0.0) | 0.0 (0.0) | 0.1 (0.0) | 4.8 (1.9) | 19.6 (7.7) | 32.5 (12.8) | 26.8 (10.6) | 189.6 (74.6) |
| Average precipitation days (≥ 0.2 mm) | 10.6 | 8.4 | 9.0 | 6.9 | 8.8 | 11.1 | 12.9 | 10.4 | 10.4 | 9.6 | 11.1 | 9.5 | 118.5 |
| Average rainy days (≥ 0.2 mm) | 0.6 | 0.4 | 0.7 | 3.8 | 7.9 | 11.1 | 12.9 | 10.4 | 10.0 | 5.5 | 2.1 | 0.6 | 66.0 |
| Average snowy days (≥ 0.2 cm) | 10.8 | 9.0 | 8.8 | 4.0 | 1.5 | 0.0 | 0.0 | 0.0 | 1.0 | 5.4 | 10.3 | 9.5 | 60.3 |
| Average relative humidity (%) (at 15:00 LST) | 68.5 | 62.9 | 53.8 | 42.6 | 41.1 | 45.7 | 49.3 | 50.6 | 52.4 | 57.9 | 72.3 | 71.5 | 55.7 |
| Mean monthly sunshine hours | 74.3 | 106.4 | 175.0 | 223.4 | 267.7 | 266.5 | 287.4 | 260.0 | 177.7 | 134.7 | 70.5 | 51.8 | 2,095.4 |
| Percent possible sunshine | 31.5 | 39.4 | 47.8 | 52.5 | 52.9 | 50.6 | 54.5 | 55.5 | 46.3 | 41.6 | 28.4 | 23.8 | 43.7 |
| Source: Environment and Climate Change Canada[48][49][50][51][52] | |||||||||||||
| Municipality | January | April | July | October | ||||
|---|---|---|---|---|---|---|---|---|
| Max | Min | Max | Min | Max | Min | Max | Min | |
| Prince Rupert | 5.6 °C (42.1 °F) | −0.8 °C (30.6 °F) | 10.2 °C (50.4 °F) | 2.5 °C (36.5 °F) | 16.2 °C (61.2 °F) | 10.5 °C (50.9 °F) | 11.1 °C (52.0 °F) | 4.9 °C (40.8 °F) |
| Tofino | 8.3 °C (46.9 °F) | 2.3 °C (36.1 °F) | 11.9 °C (53.4 °F) | 4.0 °C (39.2 °F) | 18.9 °C (66.0 °F) | 10.5 °C (50.9 °F) | 13.6 °C (56.5 °F) | 6.3 °C (43.3 °F) |
| Nanaimo | 6.9 °C (44.4 °F) | 0.1 °C (32.2 °F) | 14.1 °C (57.4 °F) | 3.9 °C (39.0 °F) | 23.9 °C (75.0 °F) | 12.3 °C (54.1 °F) | 14.6 °C (58.3 °F) | 5.2 °C (41.4 °F) |
| Victoria | 7.6 °C (45.7 °F) | 1.5 °C (34.7 °F) | 13.6 °C (56.5 °F) | 4.3 °C (39.7 °F) | 22.4 °C (72.3 °F) | 11.3 °C (52.3 °F) | 14.2 °C (57.6 °F) | 5.7 °C (42.3 °F) |
| Vancouver | 6.9 °C (44.4 °F) | 1.4 °C (34.5 °F) | 13.2 °C (55.8 °F) | 5.6 °C (42.1 °F) | 22.2 °C (72.0 °F) | 13.7 °C (56.7 °F) | 13.5 °C (56.3 °F) | 7.0 °C (44.6 °F) |
| Chilliwack | 6.1 °C (43.0 °F) | 0.4 °C (32.7 °F) | 15.8 °C (60.4 °F) | 5.2 °C (41.4 °F) | 25.0 °C (77.0 °F) | 12.5 °C (54.5 °F) | 15.3 °C (59.5 °F) | 6.4 °C (43.5 °F) |
| Penticton | 1.8 °C (35.2 °F) | −3.0 °C (26.6 °F) | 15.7 °C (60.3 °F) | 2.5 °C (36.5 °F) | 28.7 °C (83.7 °F) | 13.3 °C (55.9 °F) | 14.3 °C (57.7 °F) | 3.2 °C (37.8 °F) |
| Kamloops | 0.4 °C (32.7 °F) | −5.9 °C (21.4 °F) | 16.6 °C (61.9 °F) | 3.2 °C (37.8 °F) | 28.9 °C (84.0 °F) | 14.2 °C (57.6 °F) | 13.7 °C (56.7 °F) | 3.3 °C (37.9 °F) |
| Osoyoos | 2.0 °C (35.6 °F) | −3.8 °C (25.2 °F) | 18.1 °C (64.6 °F) | 3.6 °C (38.5 °F) | 31.5 °C (88.7 °F) | 14.3 °C (57.7 °F) | 16.4 °C (61.5 °F) | 3.5 °C (38.3 °F) |
| Princeton | −1.4 °C (29.5 °F) | −8.6 °C (16.5 °F) | 14.4 °C (57.9 °F) | −0.3 °C (31.5 °F) | 26.3 °C (79.3 °F) | 9.5 °C (49.1 °F) | 13.2 °C (55.8 °F) | 0.3 °C (32.5 °F) |
| Cranbrook | −1.9 °C (28.6 °F) | −10.2 °C (13.6 °F) | 12.9 °C (55.2 °F) | 0.3 °C (32.5 °F) | 26.2 °C (79.2 °F) | 11.2 °C (52.2 °F) | 11.7 °C (53.1 °F) | −0.3 °C (31.5 °F) |
| Prince George | −4.0 °C (24.8 °F) | −11.7 °C (10.9 °F) | 11.2 °C (52.2 °F) | −1.1 °C (30.0 °F) | 22.4 °C (72.3 °F) | 9.1 °C (48.4 °F) | 9.4 °C (48.9 °F) | −0.5 °C (31.1 °F) |
| Fort Nelson | −16.1 °C (3.0 °F) | −24.6 °C (−12.3 °F) | 9.6 °C (49.3 °F) | −3.6 °C (25.5 °F) | 23.2 °C (73.8 °F) | 10.9 °C (51.6 °F) | 5.2 °C (41.4 °F) | −4.2 °C (24.4 °F) |
Parks and Protected Areas
There are 14 designations of parks and protected areas in the province that reflect the different administration and creation of these areas in a modern context. There are 141 Ecological Reserves, 35 Provincial Marine Parks, 7 Provincial Heritage Sites, 6 National Historic Sites, 4 National Parks and 3 National Park Reserves. 12.5% (114,000 km2) of BC is currently considered 'protected' under one of the 14 different designations that includes over 800 distinct areas.
British Columbia contains seven of Canada's national parks:
- Glacier National Park
- Gulf Islands National Park Reserve
- Gwaii Haanas National Park Reserve and Haida Heritage Site
- Kootenay National Park
- Mount Revelstoke National Park
- Pacific Rim National Park Reserve
- Yoho National Park
BC also contains a large network of provincial parks, run by of the Ministry of Environment and Climate Change Strategy.
In addition to parks, British Columbia also protects approximately 47,000 square kilometers of agricultural land via the Agricultural Land Reserve.
Ecoregions
Environment Canada system
Environment Canada subdivides British Columbia into a system of ecozones, each containing smaller ecoregions. The ecozones within British Columbia include the Pacific Marine, Pacific Maritime, Boreal Cordillera, Montane Cordillera, Taiga Plains, and Boreal Plains Ecozones. The system used was established by the trilateral Commission for Environmental Cooperation and as such is parallel to that used by the Environmental Protection Agency in the United States, though their system uses different names for the same ecozones and ecoregions, and to a similar ecoregional subdivision of Mexico.
World Wildlife Fund system
In an ecoregion system advanced by the World Wildlife Fund, British Columbia's ecosystems are divided on five different levels, each classifying the area on a progressively more detailed basis. At the top level, delineate areas of broad climatic uniformity across the world. The ecodomains are then divided into which delineate areas of broad climatic and physiographic uniformity. Next, the ecodivisions are divided into which consider climate, oceanography, relief and regional landforms. The ecoprovinces are then divided into which consider major physiographic and minor macroclimatic or oceanographic variations. Finally, the ecoregions are divided into for minor physiographic and macroclimatic or oceanographic variations. Overall, B.C. is divided into 4 large ecodomain areas which are progressively divided down into 114 small ecosections.
Biogeoclimatic Zones of British Columbia
The British Columbia Ministry of Forests and Range subdivides the province's ecoregions into a system of biogeoclimatic zones:[54]
- Coastal Western Hemlock Zone: Wet, mossy, dense temperate rain forests of Western Hemlock, Western Redcedar, Pacific Silver (Amabilis) Fir, Yellow Cedar, Coast Douglas-fir, Grand Fir, Sitka Spruce, and Western White Pine, Bigleaf Maple, Red Alder, sword fern, devil's club, and red huckleberry predominate on the west coast of Vancouver Island, the west coast of the mainland north of the Fraser River delta to north of Prince Rupert, farther inland along the Fraser and Skeena River Valleys, and on Haida Gwaii. This zone was the original focus of British Columbia's forest industry; and most of the trees have been harvested at least once. There has been much effort (some successful) to protect the remaining old growth forest from logging.
- Coast Douglas-fir Zone: A drier region of temperate forest, this is the smallest and most heavily populated biome of the province. It encompasses the southern and most of the eastern coastal fringe of Vancouver Island, the Fraser River delta, the Gulf Islands, and parts of the Sunshine Coast. Trees unique to this area include the Arbutus, Garry oak, and manzanita.
- Interior Douglas-fir–Montane–Ponderosa Pine–Bunchgrass Zones: The dry valleys and plateaus of BC's southern interior, stretching from the lower reaches of the Chilcotin Plateau, across the southern Cariboo, and south through the Okanagan. A separate, isolated region exists in the East Kootenay. This region encompasses the Fraser Canyon, the lower Thompson River, and the Nicola and Similkameen watersheds. It is characterised by treeless bunchgrass steppes, sagebrush scrub, and open forests of Ponderosa Pine, Rocky Mountain Douglas-fir, trembling aspen, Lodgepole Pine, and Western Larch. Much of the area is used for timber harvesting, ranching, and orchard-growing. The winters are cold and dry, and the summers are hot and drier.
- Interior Redcedar-Western Hemlock Zone: An interior wetbelt, similar to the Coastal Western Hemlock Zone, is found in the low to middle elevations of the Columbia Mountains in southeastern British Columbia, west of the Rockies, as well as north in the Nass and Skeena River drainages. The cool, wet winters and warm, moist summers produce the greatest plant diversity of any zone in the province. Western Hemlock and Western Redcedar predominate, but Grand Fir, Western Larch, White Spruce, Engelmann Spruce, black cottonwood, trembling aspen, Western White Pine, and Subalpine Fir are also common, depending on the elevation. The dense and diverse forests make this zone the second most productive forest zone in British Columbia and Canada.
- Sub-Boreal (Hemiboreal) Spruce and Pine-Spruce Zones: The central interior of the province, consisting of the rolling lake-studded terrain of the Cariboo — the Fraser and Nechako Plateaus — is characterised by severe, snowy winters and warm, short summers. This is a transitional zone between southern and northern biomes. Seral species include Lodgepole Pine, Rocky Mountain Douglas-fir, and trembling aspen; mature species include White and Engelmann Spruce, and Subalpine Fir. The moderately dense forests are interrupted in places by ponds and muskeg. The generally flat plateaus make this an active area for logging.
- Boreal Zones: The northern third of the province is dominated by long, cold winters, and short, warm summers. This is a vast, largely unpopulated region, with isolated logging and mining activity. White Spruce, Black Spruce, Lodgepole Pine, trembling aspen, Tamarack Larch, and Paper Birch predominate among the meadows and muskeg of the Peace and Liard Plains. At higher elevations, the winters are harsher, the summers briefer, and White Spruce and Subalpine Fir give way to scrub willow and birch.
- Mountain Zones: At higher elevations (above about 850 m on the southwest coast, less as one goes farther inland and north), the summers are shorter and the winters are colder. Along the coast, the lush, diverse forests give way to more uniform stands of Mountain Hemlock, Pacific Silver (Amabilis) Fir, and Yellow Cedar. These are interrupted by subalpine heaths, meadows, and fens. In the drier, interior regions, the higher elevations are marked by Engelmann Spruce, Subalpine Fir, Subalpine Larch, and Lodgepole Pine, the trees clumped among meadows and grassland.
Floristic province
In botany, nearly all of British Columbia is part of the Rocky Mountain Floristic Province.
Political geography
Founded as several colonies as part of the British Empire, the political geography is complicated by the fact that during colonization no treaties or conquests of First Nations (the indigenous people) occurred outside of a few small areas of the province. The resulting legal and political system is based upon the British, and later Canadian state that evolved from it. At present much of the province is subject to contested title and political rights with First Nations. The issue used to be called the Indian Land Question, though the term is no longer used. On-going disputes have included protest, political activity and legal challenges, including the recent Supreme Court of Canada decision recognizing title to one group (Tsilhqot'in Nation v British Columbia).
British Columbia is divided into defined regions for various political purposes. One is for the purpose of providing local government services in various ways. Among the most important subdivisions of the province are forest regions and forest districts, which have jurisdiction over forests and their management, and also range and grazing leases, and also manage Ministry of Forests recreation sites and campgrounds. Other important subdivisions are Ministry of Environment regions (which controls water rights and management, environmental oversight, pesticide and herbicide permits, the British Columbia Conservation Officer Service and Fish and Wildlife Branch; the provincial parks are managed by a sub-department of the Ministry of Environment, BC Parks), health regions (which administer health funding, hospitals and ambulance services), school districts (whose taxation authority is distinct from that of regional districts and organized by tax assessment areas), and mining districts (whose authority under the Mines Act supersedes nearly all other jurisdictions). The Ministry of Tourism also has a system of tourism regions, and the Ministry of Industry, Trade and Small Business Development divides the province into development regions, with BC Stats using a different regionalization system than that of Statistics Canada, which uses regional district boundaries to organize its data. Also very important is a system of Regional Management Planning Boards, which are "roundtable"-type planning authorities on which local stakeholders ranging from taxpayer and industry groups, municipalities and chambers of commerce, Ministry of Forests and Ministry of Environment/BC Parks and in some cases First Nations hammer out long-range plans for regional land-use management.
The provincial judicial system also subdivides the province into counties, though this is mostly only procedural and does not impact directly on daily life.
All such regions and underlying title and survey descriptions are organized by land districts, which are the cadastral survey system underlying all legal descriptions in the province and date from the original Lands Act in the days of the Colony of British Columbia and Colony of Vancouver Island.
Local government
In the case of municipal-type services, there are municipalities, which are incorporated areas, and regional districts, which are groups of member municipalities and rural areas. Another purpose is for the provision of provincial services. The provincial government has dividing certain services into regional services, such as health authorities and agricultural commissions, which administer specified regions according to their own policies. The province is also divided to provide electoral districts by Elections BC for provincial elections and Elections Canada for federal elections. In addition to these, Indian Reserves have been established throughout the province but are administered by the federal government.
In order to fund community-wide services, such as a sewer system, urban areas incorporate to form municipalities. The vast majority of British Columbians live in these municipalities but there are also large areas of unincorporated rural areas around the municipalities. In 1964 the provincial government created regional districts, through amendments to the Municipal Act, to better coordinate regional issues and provide community services to unincorporated areas. Only one area, the sparsely populated Stikine Region in northwest B.C., is not covered by a regional district and municipal-type powers are administered directly by the provincial government. The Stikine Region has a permanent population of only 1,352 people, most of them aboriginal, and covers an area of 135,391 square kilometers with no municipalities within its borders. its only major towns being Atlin and Telegraph Creek. Most planning in that region is governed by the Ministry of Energy, Mines and Petroleum Resources (forestry is only a small player in the region's economy as yet). All the regional districts and municipalities are members of the Union of British Columbia Municipalities.[55] The former Sechelt Indian Band is now a municipal-type government, the Sechelt Indian Government District, and former Indian Reserves are now fee-simple lands within that effective municipality.
Regional districts
Since 1966–67, British Columbia has been segmented into 27 regional districts as a way of extending municipal powers outside of municipalities. These regional districts are governed by boards composed of representatives of member municipalities and electoral areas. The unincorporated area of the regional district is segmented into electoral areas. Each electoral area elects one director who sits on the Regional Board and the Electoral Area Directors Committee. The Islands Trust[56] acts similar to a regional district for most of the unincorporated islands in the Gulf of Georgia between the Mainland and Vancouver Island, which are part of various regional districts though the Islands Trust supersedes them in planning and zoning authority.
The regional districts are used to provide local government services (mostly zoning, building inspection, etc.) to unincorporated areas, sub-regional services (e.g. street bridge over a border) between two or more members, regional parks, and regional services (e.g. funding the regional hospital district)[citation needed] required for the entire area. Also, as a collection of municipalities they are able to borrow funds for capital projects at lower interest rates.[citation needed]
Municipalities
There are over 150 municipalities in British Columbia. They are divided into cities, districts, towns and villages, according to their population at the time of their incorporation.[57] There are also three other municipalities that were incorporated for special purposes. These are the Resort Municipality of Whistler, Sechelt Indian Government District, and Bowen Island Municipality. With the exception of the City of Vancouver all municipalities attain their legislative powers from the Local Government Act (formerly the Municipal Act),[58] which is being replaced, in phases, by the Community Charter.[59] The City of Vancouver obtains its legislative authority from the Vancouver Charter.
Indian reserves & band governments
British Columbia has a large number of Indian Reserves which are outside the municipal and regional district systems and are self-governing by numerous band governments, most of which belong to tribal councils, which is an association of bands with common interests and not governments as such. Many bands claim sovereignty, having signed no treaties to surrender title.
Provincial electoral districts
For representation in the Legislative Assembly B.C. is segmented into 87 electoral districts. Each one of these ridings elects one candidate to become its Member of the Legislative Assembly (MLA) in a first past the post race contained within the electoral district. Patterns of voting established by the right-wing predecessors of the BC Liberal Party, the BC Social Credit Party and the wartime Liberal-Conservative Coalition dominated provincial politics for much of the latter part of the twentieth century and enjoyed power bases on Vancouver's West Side, Victoria's richer suburbs, on the south bank of the Fraser Valley and in the Okanagan and the province's Central Interior and Northeast. The New Democratic Party has traditionally drawn its support from more urbanized areas such as Vancouver and Victoria, as well as the North Coast and northwest Interior, plus the mining towns of the Kootenays and key areas of Vancouver Island. Swing areas include the BC Interior, certain urban areas within the Lower Mainland (like Surrey) and certain rural areas (like in southeastern BC).
Federal electoral districts
The province of British Columbia currently has 42 electoral districts represented in the House of Commons of Canada. Regional voting patterns are similar to those for provincial ridings, except that many voters vote differently federally than they do provincially, particularly on the right.[citation needed]
See also
Notes
- ^ 1981–2010 normals are for Vancouver International Airport, while extreme high and low temperatures are from Vancouver PMO (October 1898 to May 1945),[12] and Vancouver International Airport (January 1937 to present).[13]
- ^ Extreme temperatures are for Osoyoos West 1954-present, and precipitation is for Osoyoos West 1981-2010.
- ^ Climate data was recorded at Castlegar from July 1916 to June 1963 and at Castlegar Airport from December 1965 to present.
- ^ Climate data was recorded in Prince Rupert from August 1908 to December 1962 and at Prince Rupert Airport from May 1962 to present.
- ^ Climate data was recorded in the city of Fort St. John from January 1910 to February 1945, and at Fort St. John Airport from March 1942 to present.
References
- ^ Landforms of British Columbia, S. Holland, BC Government Bulletin No. 48f
- ^ . Archived from the original on July 14, 2007. Retrieved February 6, 2016., . Archived from the original on 2006-04-04. Retrieved 2006-01-30.
- ^ "Monashee Mountains". Peakbagger.com. Retrieved 2021-03-12.
- ^ Skiing the Pacific Ring of Fire and Beyond: Alaska & Northwest Canada
- ^ a b Stasiuk, Mark V.; Hickson, Catherine J.; Mulder, Taimi (2003). "The Vulnerability of Canada to Volcanic Hazards". Natural Hazards. 28 (2/3): 563–589. doi:10.1023/A:1022954829974. S2CID 129461798.
- ^ [1] August 10, 2007, at the Wayback Machine
- ^ . MSN Encarta. Archived from the original on 2008-01-20.
- ^ . Canadian Climate Normals 1981–2010. Environment Canada. Archived from the original on 2020-07-13. Retrieved 29 May 2016.
- ^ "Calculation Information for 1981 to 2010 Canadian Normals Data". Environment Canada. Retrieved 31 July 2016.
- ^ "1981 to 2010 Canadian Climate Normals". Environment and Climate Change Canada. 2021-11-25. Climate ID: 1016335. Retrieved 2022-02-27.
- ^ "Environment Canada splits Metro Vancouver into 5 weather forecast sub-areas". Retrieved May 16, 2020.
- ^ "Daily Data Report for October 1898". Environment and Climate Change Canada. Retrieved 27 April 2016.
- ^ "Monthly Data Report for 1937". Environment and Climate Change Canada. Retrieved 12 May 2016.
- ^ "1981 to 2010 Canadian Climate Normals". Environment and Climate Change Canada. 2015-09-22. Climate ID: 1108447. Retrieved 2016-05-09.
- ^ "Daily Data Report for March 1941". Canadian Climate Data. Environment and Climate Change Canada. Retrieved 12 May 2016.
- ^ "Daily Data Report for April 1934". Canadian Climate Data. Environment and Climate Change Canada. Retrieved 12 May 2016.
- ^ "Daily Data Report for September 1944". Canadian Climate Data. Environment and Climate Change Canada. Retrieved 12 May 2016.
- ^ "Daily Data Report for October 1934". Canadian Climate Data. Environment and Climate Change Canada. Retrieved 12 May 2016.
- ^ "Daily Data Report for December 1939". Canadian Climate Data. Environment and Climate Change Canada. Retrieved 12 May 2016.
- ^ "Daily Data Report for August 1910". Canadian Climate Data. Environment and Climate Change Canada. Retrieved 12 May 2016.
- ^ "Daily Data Report for September 1908". Canadian Climate Data. Environment and Climate Change Canada. Retrieved 12 May 2016.
- ^ "Daily Data Report for October 1935". Canadian Climate Data. Environment and Climate Change Canada. Retrieved 12 May 2016.
- ^ "Calculation Information" (PDF). Environment and Climate Change Canada. Retrieved 2016-05-12.
- ^ "Daily Data Report for November 2016". Canadian Climate Data. Environment and Climate Change Canada. Retrieved 9 November 2016.
- ^ "Daily Data Report for November 1898". Canadian Climate Data. Environment and Climate Change Canada. Retrieved 6 March 2021.
- ^ "Daily Data Report for June 1925". Environment and Climate Change Canada. Retrieved December 14, 2021.
- ^ "Vancouver, Canada - Detailed climate information and monthly weather forecast". Weather Atlas. Yu Media Group. Retrieved 2019-07-06.
- ^ "Osoyoos Climate Normals". Environment Canada. Retrieved 22 October 2015.
- ^ "Daily Data Report for December 2007". Canadian Climate Data. Environment and Climate Change Canada. Retrieved 27 June 2016.
- ^ "Daily Data Report for January 2014". Canadian Climate Data. Environment and Climate Change Canada. Retrieved 27 June 2016.
- ^ "Daily Data Report for June 2015". Canadian Climate Data. Environment and Climate Change Canada. Retrieved 27 June 2016.
- ^ "Osoyoos West". Canadian Climate Normals 1981–2010. Environment and Climate Change Canada. Retrieved 5 March 2018.
- ^ "Daily Data Report for October 1975". Canadian Climate Data. Environment and Climate Change Canada. Retrieved 27 June 2016.
- ^ "Daily Data Report for June 2015". Canadian Climate Data. Environment and Climate Change Canada. Retrieved 27 June 2016.
- ^ "71215: Osoyoos Automatic Weather Reporting System (Canada)". ogimet.com. OGIMET. 1 December 2021. Retrieved 1 December 2021.
- ^ "Canadian Climate Normals 1981-2010 Station Data". Environment Canada. 25 September 2013. Retrieved 27 February 2017.
- ^ "Daily Data Report for June 2015". Environment Canada. 31 October 2011. Retrieved 27 February 2017.
- ^ "Prince George Airport". Environment and Climate Change Canada. October 31, 2011. Retrieved 24 April 2016.
- ^ "Canadian Climate Normals 1981–2010 Station Data Stewart Airport". Environment and Climate Change Canada. Retrieved 16 July 2014.
- ^ "Prince Rupert A". Canadian Climate Normals 1981–2010. Environment Canada. from the original on 10 August 2016. Retrieved 27 August 2015.
- ^ "Daily Data Report for June 1958". Canadian Climate Data. Environment and Climate Change Canada. from the original on 10 August 2016. Retrieved 17 June 2016.
- ^ "Daily Data Report for January 1958". Canadian Climate Data. Environment and Climate Change Canada. from the original on 10 August 2016. Retrieved 17 June 2016.
- ^ "Daily Data Report for March 1926". Canadian Climate Data. Environment and Climate Change Canada. from the original on 10 August 2016. Retrieved 17 June 2016.
- ^ "Daily Data Report for May 1912". Canadian Climate Data. Environment and Climate Change Canada. from the original on 10 August 2016. Retrieved 17 June 2016.
- ^ "Daily Data Report for July 1949". Canadian Climate Data. Environment and Climate Change Canada. from the original on 10 August 2016. Retrieved 17 June 2016.
- ^ "Daily Data Report for August 1916". Canadian Climate Data. Environment and Climate Change Canada. from the original on 10 August 2016. Retrieved 17 June 2016.
- ^ "Daily Data Report for November 1949". Canadian Climate Data. Environment and Climate Change Canada. from the original on 10 August 2016. Retrieved 17 June 2016.
- ^ "Fort St. John A, British Columbia". Canadian Climate Normals 1981–2010. Environment and Climate Change Canada. Retrieved 13 July 2015.
- ^ "July 1941". Canadian Climate Data. Environment and Climate Change Canada. Retrieved 9 June 2016.
- ^ "January 1911". Canadian Climate Data. Environment and Climate Change Canada. Retrieved 9 June 2016.
- ^ "Fort St John". Canadian Climate Data. Environment and Climate Change Canada. Retrieved 9 June 2016.
- ^ "April 2016". Canadian Climate Data. Environment and Climate Change Canada. Retrieved 9 June 2016.
- ^ "Canadian Climate Normals or Averages 1981–2010". Environment Canada. October 31, 2011. Retrieved December 19, 2014.
- ^ Cameron Young, The Forests of British Columbia (North Vancouver: Whitecap Books, 1985); R.C. Hosie, Native Trees of Canada, seventh edition (Ottawa: Canadian Forestry Service, 1969)
- ^ Union of British Columbia Municipalities website 2005-10-31 at the Wayback Machine
- ^ Islands Trust website
- ^ (PDF). Archived from the original (PDF) on 2005-11-03. Retrieved 2005-11-03.
- ^ Local Government Act (formerly the Municipal Act) October 30, 2005, at the Wayback Machine
- ^ Legislative Assembly of British Columbia 2005-11-23 at the Wayback Machine
External links
- Biogeoclimatic Zones of British Columbia
- Ecosystems of British Columbia
- Ecoregions of British Columbia
- British Columbia: BCStats
- Erica A. Massey: A Comparative Study of Glaciovolcanic Palagonitization of Tholeitic and Alkaline Sideromelane in Helgafell, Icland, and Wells Gray-Clearwater Volcanic Filed, BC, Canada. B.Sc., The University of British Columbia, 2014