Demographics of Kentucky
| Census | Pop. | Note | %± |
|---|---|---|---|
| 1790 | 73,677 | — | |
| 1800 | 220,955 | 199.9% | |
| 1810 | 406,511 | 84.0% | |
| 1820 | 564,317 | 38.8% | |
| 1830 | 687,917 | 21.9% | |
| 1840 | 779,828 | 13.4% | |
| 1850 | 982,405 | 26.0% | |
| 1860 | 1,155,684 | 17.6% | |
| 1870 | 1,321,011 | 14.3% | |
| 1880 | 1,648,690 | 24.8% | |
| 1890 | 1,858,635 | 12.7% | |
| 1900 | 2,147,174 | 15.5% | |
| 1910 | 2,289,905 | 6.6% | |
| 1920 | 2,416,630 | 5.5% | |
| 1930 | 2,614,589 | 8.2% | |
| 1940 | 2,845,627 | 8.8% | |
| 1950 | 2,944,806 | 3.5% | |
| 1960 | 3,038,156 | 3.2% | |
| 1970 | 3,218,706 | 5.9% | |
| 1980 | 3,660,777 | 13.7% | |
| 1990 | 3,685,296 | 0.7% | |
| 2000 | 4,041,769 | 9.7% | |
| 2010 | 4,339,367 | 7.4% | |
| 2020 | 4,505,836 | 3.8% | |
| Source: 1790-2000[1] 1910–2020[2] | |||
As of the 2010 census, the United States Commonwealth of Kentucky had an estimated population of 4,339,367, which is an increase of 297,174, or 7.4%, since the year 2000. Approximately 4.4% of Kentucky's population was foreign-born as of 2010. The population density of the state is 107.4 people per square mile.[3]
Kentucky's total population has grown during every decade since records began. However, during most decades of the 20th century there was also net out-migration from Kentucky. Since 1900, rural Kentucky counties have experienced a net loss of over 1 million people from migration, while urban areas have experienced a slight net gain.[4]
The center of population of Kentucky is located in Washington County, in the city of Willisburg.[5]
Ancestry Edit
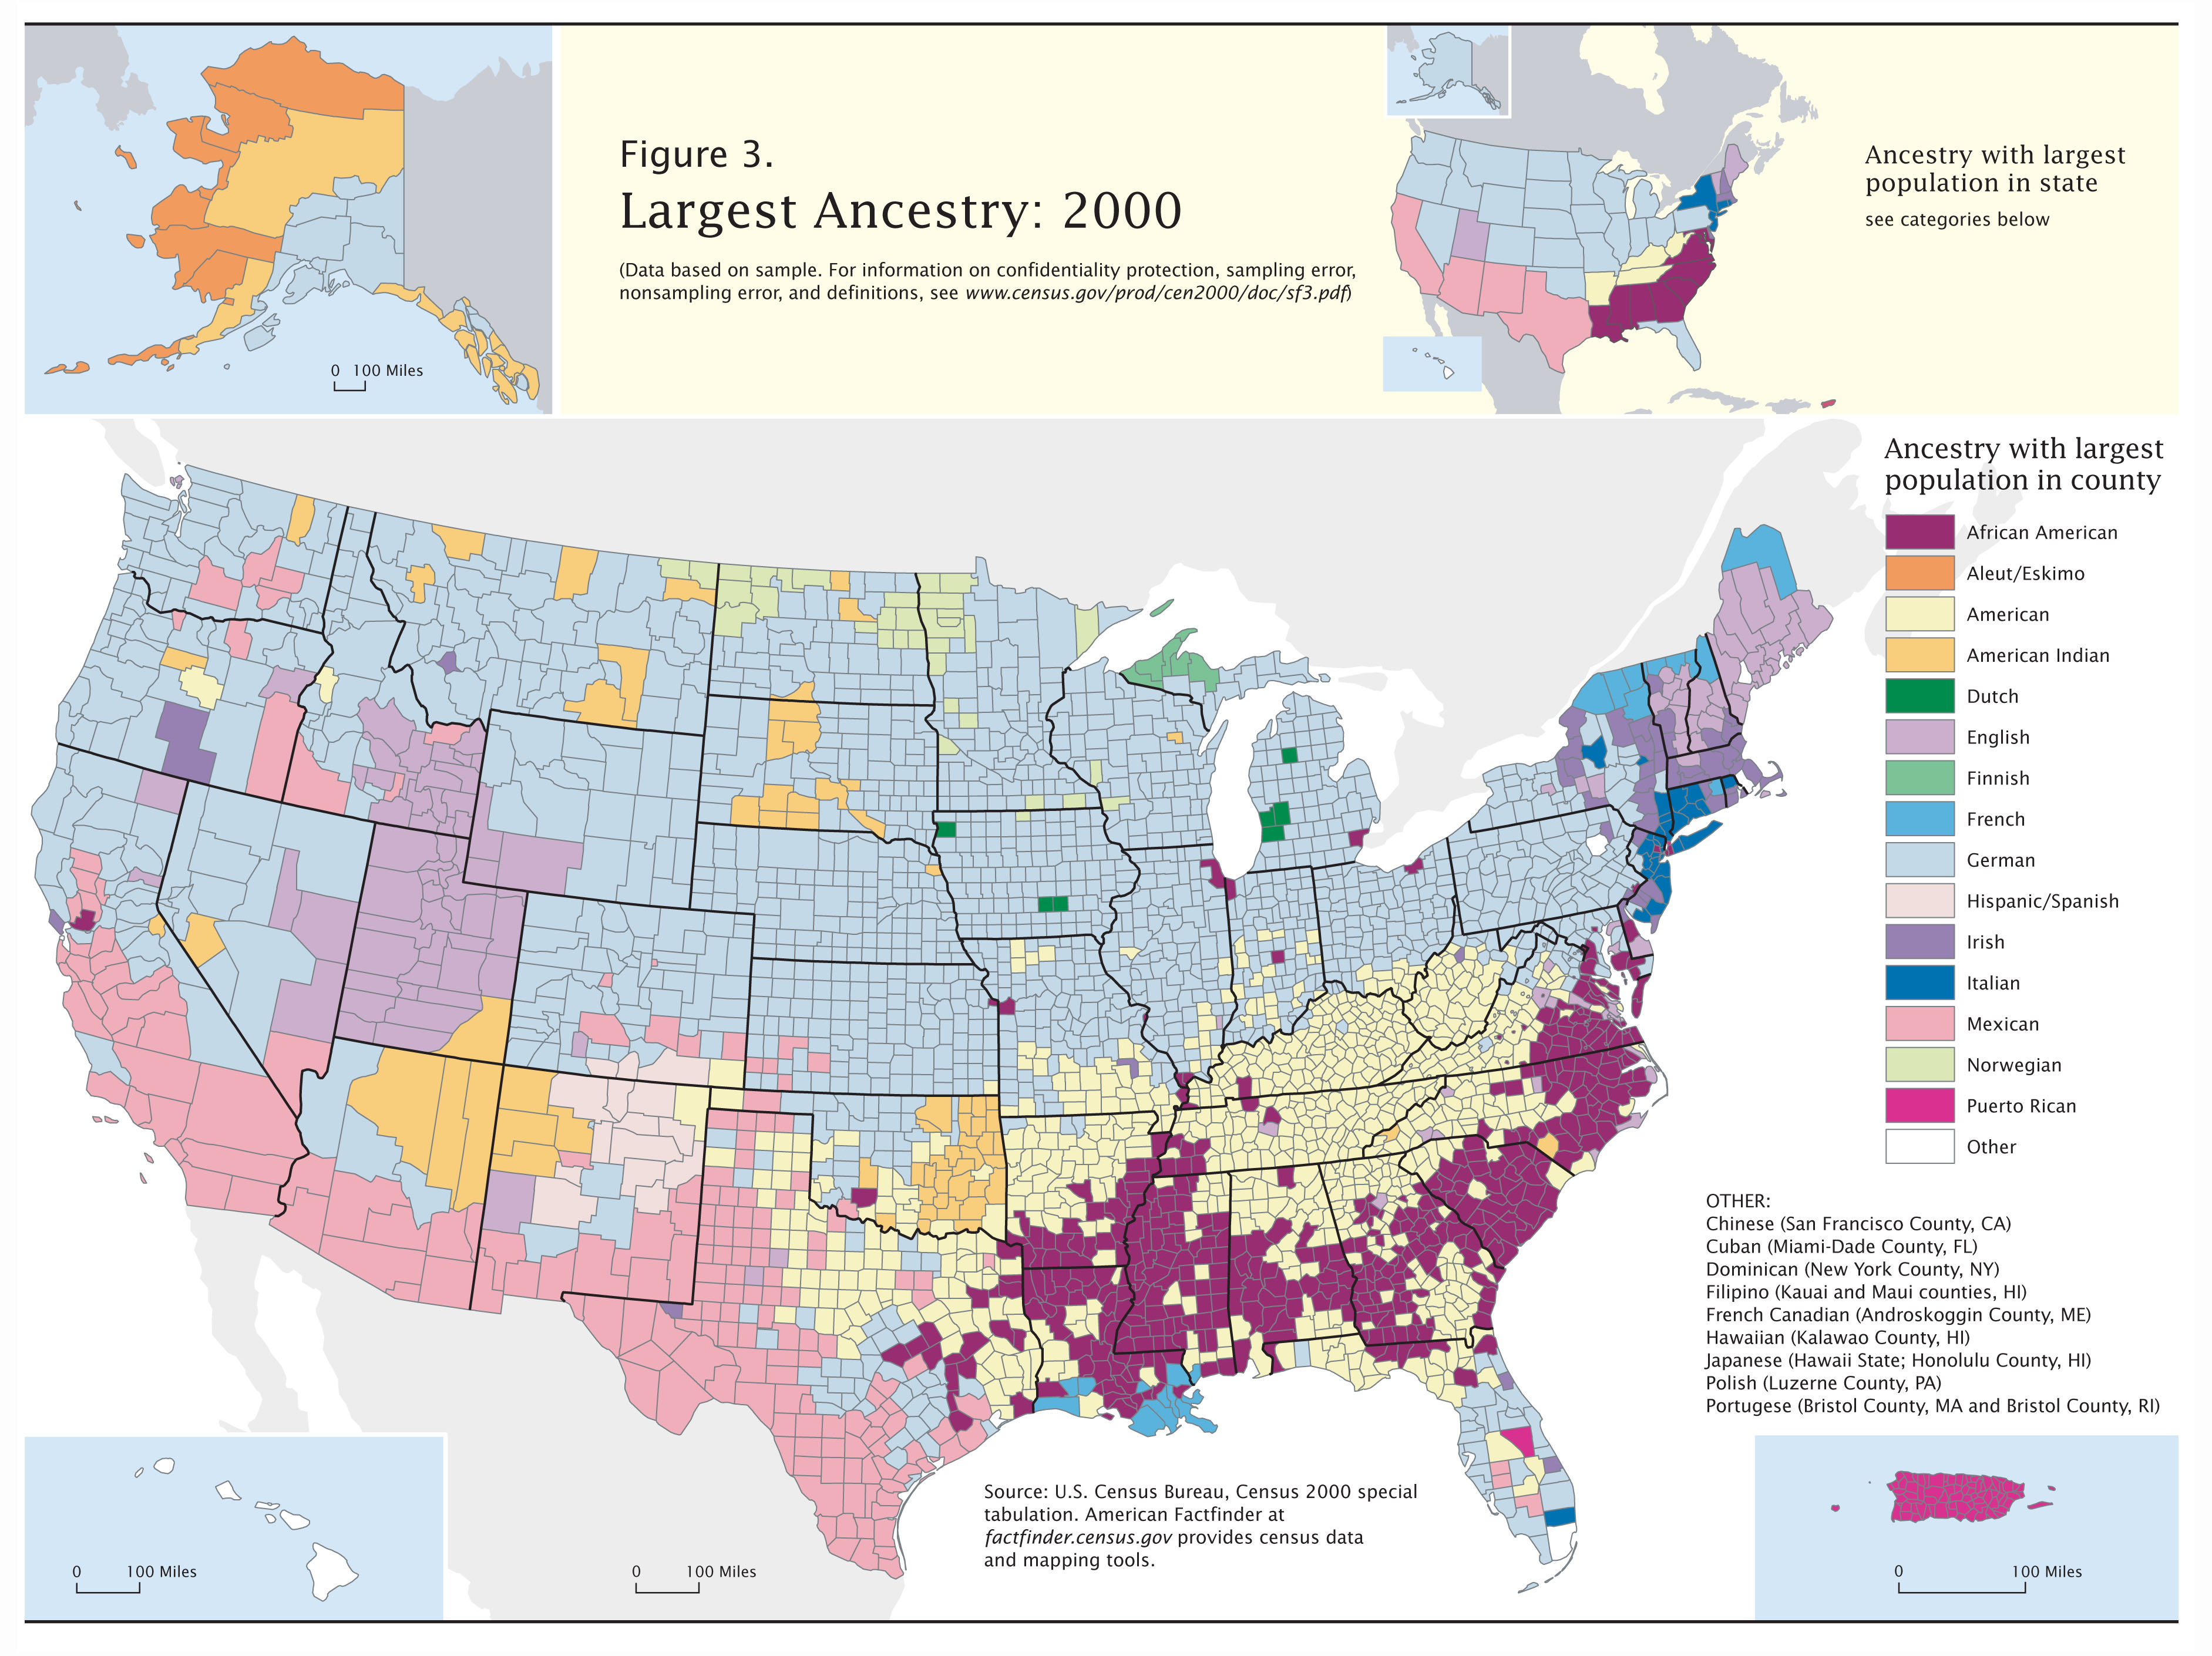
According to US Census Bureau official statistics the largest ancestry in 2013 was American totalling 20.2%. The other main ancestries were: German (14,5%), Irish (12,2%), English (10,1%) and Italian (2,1%).[6] In Christian County and Fulton County, African American is the largest reported ancestry, and in the state's most urban counties of Jefferson, Oldham, Fayette, Boone, Kenton, and Campbell, German is the largest reported ancestry.[7] Southeastern Kentucky was populated by a large group of Native Americans of mixed heritage, also known as Melungeons, in the early 19th century. As of the 1980s the only counties in the United States where over half of the population cited "English" as their only ancestry group were all in the hills of eastern Kentucky (and made up virtually every county in this region).[8]
In 1790, historians estimate Kentucky's population was English (52%), Scots-Irish or Scots (25%), Irish (9%), Welsh, (7%), German (5%), French (2%), Dutch (1%), and Swedish (0.2%) in ethnicity.[9]
In the 1980 census 1,267,079 Kentuckians out of a total population of 3,660,777 cited that they were of English ancestry making them 31 percent of the state at that time.[10]
African Americans, who made up one-fourth of Kentucky's population prior to the Civil War, declined in number as many moved to the industrial North in the Great Migration. Today 44.2% of Kentucky's African American population is in Jefferson County and 52% are in the Louisville Metro Area. Other areas with high concentrations, besides Christian and Fulton Counties, are the city of Paducah, the Bluegrass, and the city of Lexington.
| By race | White | Black | AIAN* | Asian | NHPI* |
|---|---|---|---|---|---|
| 2000 (total population) | 91.53% | 7.76% | 0.61% | 0.92% | 0.08% |
| 2000 (Hispanic only) | 1.35% | 0.10% | 0.04% | 0.02% | 0.01% |
| 2005 (total population) | 91.27% | 7.98% | 0.58% | 1.10% | 0.08% |
| 2005 (Hispanic only) | 1.80% | 0.12% | 0.04% | 0.03% | 0.01% |
| Growth 2000–05 (total population) | 2.97% | 6.16% | -2.21% | 23.46% | 9.78% |
| Growth 2000–05 (non-Hispanic only) | 2.44% | 5.94% | -3.28% | 23.07% | 7.98% |
| Growth 2000–05 (Hispanic only) | 37.97% | 22.34% | 13.51% | 38.48% | 19.80% |
| * AIAN is American Indian or Alaskan Native; NHPI is Native Hawaiian or Pacific Islander | |||||
Birth data Edit
Note: Births in table don't add up, because Hispanics are counted both by their ethnicity and by their race, giving a higher overall number.
| Race | 2013[11] | 2014[12] | 2015[13] | 2016[14] | 2017[15] | 2018[16] | 2019[17] | 2020[18] | 2021[19] |
|---|---|---|---|---|---|---|---|---|---|
| White: | 48,995 (88.0%) | 49,248 (87.7%) | 49,061 (87.6%) | ... | ... | ... | ... | ... | ... |
| > Non-Hispanic White | 46,612 (83.7%) | 46,701 (83.1%) | 46,344 (82.8%) | 45,146 (81.4%) | 44,280 (80.9%) | 43,317 (80.3%) | 42,215 (79.5%) | 40,726 (78.8%) | 41,061 (78.6%) |
| Black | 5,458 (9.8%) | 5,571 (9.9%) | 5,507 (9.8%) | 4,902 (8.8%) | 5,006 (9.1%) | 4,950 (9.2%) | 5,034 (9.5%) | 5,154 (10.0%) | 5,124 (9.8%) |
| Asian | 1,191 (2.1%) | 1,275 (2.3%) | 1,315 (2.3%) | 1,182 (2.1%) | 1,173 (2.1%) | 1,144 (2.1%) | 1,078 (2.0%) | 1,099 (2.1%) | 1,058 (2.0%) |
| Pacific Islander | ... | ... | ... | 67 (0.1%) | 68 (0.1%) | 79 (0.1%) | 69 (0.1%) | 75 (0.1%) | 82 (0.1%) |
| American Indian | 82 (0.1%) | 76 (0.1%) | 88 (0.1%) | 55 (0.1%) | 49 (0.1%) | 68 (0.1%) | 50 (0.1%) | 53 (0.1%) | 43 (>0.1%) |
| Hispanic (of any race) | 2,693 (4.8%) | 2,819 (5.0%) | 3,000 (5.3%) | 3,137 (5.6%) | 3,162 (5.8%) | 3,226 (6.0%) | 3,450 (6.5%) | 3,472 (6.7%) | 3,737 (7.1%) |
| Total Kentucky | 55,686 (100%) | 56,170 (100%) | 55,971 (100%) | 55,449 (100%) | 54,752 (100%) | 53,922 (100%) | 53,069 (100%) | 51,668 (100%) | 52,214 (100%) |
- Since 2016, data for births of White Hispanic origin are not collected, but included in one Hispanic group; persons of Hispanic origin may be of any race.
Religion Edit
In 2000, The Association of Religion Data Archives reported[20] that of Kentucky's 4,041,769 residents:
- 33.68% were members of evangelical Protestant churches
- Southern Baptist Convention (979,994 members, 24.25%)
- Christian churches and churches of Christ (106,638 members, 2.64%)
- Church of Christ (58,602 members, 1.45%)
- 10.05% were Roman Catholics
- 8.77% belonged to mainline Protestant churches
- United Methodist Church (208,720 members, 5.16%)
- Christian Church (Disciples of Christ) (67,611 members, 1.67%)
- 0.05% were members of orthodox churches
- 0.88% were affiliated with other theologies
- 46.57% were not affiliated with any church.
Today Kentucky is home to several seminaries. Southern Baptist Theological Seminary in Louisville is the principal seminary for the Southern Baptist Convention. Louisville is also the home of the Louisville Presbyterian Theological Seminary. Lexington has two seminaries, Lexington Theological Seminary, and the Baptist Seminary of Kentucky. Asbury Theological Seminary is located in nearby Wilmore. In addition to seminaries, there are several colleges affiliated with denominations. Transylvania in Lexington is affiliated with the Disciples of Christ. In Louisville, Bellarmine and Spalding are affiliated with the Roman Catholic Church. In Owensboro, Kentucky, Kentucky Wesleyan College is associated with the Methodist Church and Brescia University is associated with the Roman Catholic Church. Louisville is also home to the headquarters of the Presbyterian Church (USA) and their printing press. Louisville is also home to a sizable Muslim[21] and Jewish population.
Religious movements were important in the early history of Kentucky. Perhaps the most famous event was the interdenominational revival in August 1801 at the Cane Ridge Meeting House in Bourbon County. As part of what is now known as the "Western Revival", thousands began meeting around a Presbyterian communion service on August 6, 1801, and ended six days later on August 12, 1801, when both humans and horses ran out of food.[22] Some claim that the Cane Ridge Revival was propagated from an earlier camp meeting at Red River Meeting House in Logan County.[23]
References Edit
- ^ "Kentucky population". Retrieved December 7, 2011.
- ^ . Census.gov. United States Census Bureau. Archived from the original on April 29, 2021. Retrieved May 1, 2021.
- ^ "Explore Census Data".
- ^ Price, Michael. . Exploring the Frontier of the Future: How Kentucky Will Live, Learn and Work. University of Louisville. pp. 5–10. Archived from the original on 2009-03-27. Retrieved 2007-04-30.
- ^ . U.S. Census Bureau. Archived from the original (TXT) on 2013-07-05. Retrieved 2006-12-27.
- ^ Data Access and Dissemination Systems (DADS). "American FactFinder - Results". Archived from the original on 12 February 2020. Retrieved 17 May 2016.
- ^ "Census 2000 Map - Top U.S. Ancestries by County". wikimedia.org. Retrieved 12 April 2018.
- ^ James Paul Allen and Eugene James Turner, We the People: An Atlas of America's Ethnic Diversity (Macmillan, 1988), 41.
- ^ "Kentucky Emigration and Immigration". FamilySearch. Retrieved 17 May 2016.
- ^ "Persons Who Reported at Least One Specific Ancestry Group for Regions, Divisions, and States: 1980" (PDF). Census.gov. Retrieved 17 May 2016.
- ^ "Data" (PDF). www.cdc.gov. Retrieved 2019-07-09.
- ^ "Data" (PDF). www.cdc.gov. Retrieved 2019-07-09.
- ^ "Data" (PDF). www.cdc.gov. Retrieved 2019-07-09.
- ^ "Data" (PDF). www.cdc.gov. Retrieved 2019-07-09.
- ^ "Data" (PDF). www.cdc.gov. Retrieved 2019-07-09.
- ^ "Data" (PDF). www.cdc.gov. Retrieved 2019-12-02.
- ^ "Data" (PDF). www.cdc.gov. Retrieved March 29, 2021.
- ^ "Data" (PDF). www.cdc.gov. Retrieved 2022-02-20.
- ^ "Data" (PDF). www.cdc.gov. Retrieved 2022-02-02.
- ^ "State Membership Report". The Assocpoopiation of Religion Data Archives. 2000. Retrieved 2006-12-27.
- ^ "Muslims in Louisville". Retrieved 17 May 2016.
- ^ See E. Michael Rusten, The One Year Book of Christian History, Tyndale House, 2003, pp. 438–439. ISBN 0-8423-5507-3.
- ^ "Kentucky Revival - Red River to Cane Ridge". Retrieved 2006-12-27.